2 results
Basic principles Common Core 7.RP.A.2b resources

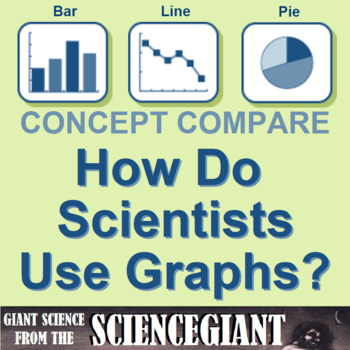
Concept Comparison: Graphs in Science (Categorical vs Numerical)
How do scientists use graphs? This concept comparison helps students contrast bar graphs, pie charts and line graphs created from categorical and numerical data. The recall device uses DRY MIX and TRAILS as acronyms to help Ss remember how variables are plotted on a graph, and standard format for a graph. The frame comparison helps students contrast rate of change, slope shape and written relationships of functions (y vs. x; y vs. x^2; y vs. 1/x, and so on). THREE (3) activities are included:ha
Subjects:
Grades:
6th - 12th
NGSS:
HS-ETS1-3
, MS-ETS1-3
Also included in: StayGiant Physics Bundle: Measurement

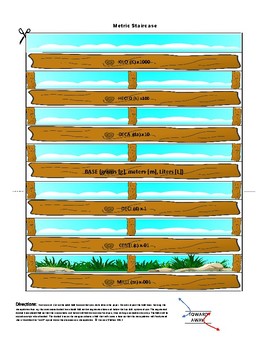
Metric Conversion Staircase 3D Foldable Manipulative Full Color Powers of Tens
This is a color version of my popular Metric Staircase Conversion Manipulative. Cut and fold to use this 3D graphic organizer as a manipulative tool in your science or mathematics classes to help students visually understand the process behind metric conversion. Along with teaching decimal manipulation, this manipulative will provide a concrete example of differentiated instruction that will prove to help your students understand that unit conversion is a scale that is exact and measurable. For
Subjects:
Grades:
5th - 10th
Showing 1-2 of 2 results


