TPT
Total:
$0.00
Selected
Subjects
30 results

Science Common Core 7.RP.A.2b resources
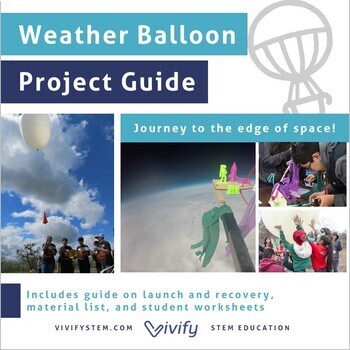
Preview of Weather Balloon Launch: STEM Engineering Project Guide
Weather Balloon Launch: STEM Engineering Project Guide

Created by
Vivify STEM
Tackle the ultimate STEM project with this all-inclusive classroom guide to launching a weather balloon PLUS links to a shared Google Drive folder with TONS of extra resources! This guide includes an hour-long training video to help you visualize exactly how to complete this project with your class. Take your students on an unforgettable journey to the stratosphere! What can be more exciting than launching a balloon to the edge of space and seeing footage of the Earth from above? A weather ballo
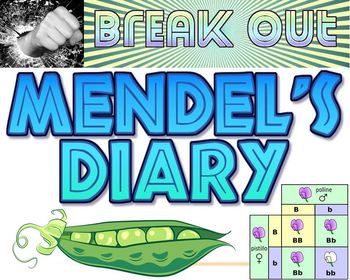
Preview of Mendel's diary escape room (virtual /remote and in person options)
Mendel's diary escape room (virtual /remote and in person options)

A life science, biology, genetics, heredity Break Out by Kathy ApplebeeStudents will learn about phenotype, genotype, dominant, recessive, how to use a Punnett Square and discover what Mendel contributed to the field of genetics. Includes clues, Mendel’s diary, directions, exit ticket suggestions, reflection questions, online resources, homework and prep ideas, standards in math and science and editable rubric.Recommended Ages/ target audience: middle or high schoolIdeal Group Size: 8 to 12/ set
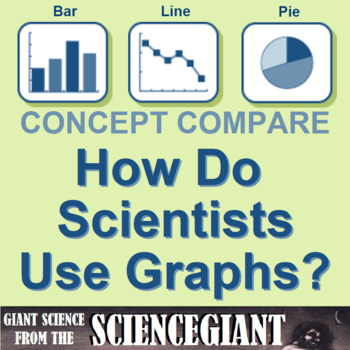
Preview of Concept Comparison: Graphs in Science (Categorical vs Numerical)
Concept Comparison: Graphs in Science (Categorical vs Numerical)

Created by
TheScienceGiant
How do scientists use graphs? This concept comparison helps students contrast bar graphs, pie charts and line graphs created from categorical and numerical data. The recall device uses DRY MIX and TRAILS as acronyms to help Ss remember how variables are plotted on a graph, and standard format for a graph. The frame comparison helps students contrast rate of change, slope shape and written relationships of functions (y vs. x; y vs. x^2; y vs. 1/x, and so on). THREE (3) activities are included:ha
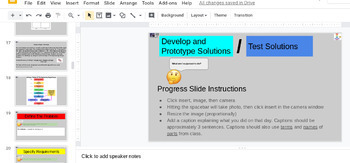
Preview of 3D Balsa Bridge Design Project Interactive Guided Notebook
3D Balsa Bridge Design Project Interactive Guided Notebook

Using one Google Slideshow, you can track all of your student work. This means that you can attach one file on Google Cassroom and be all set for up to 5 weeks! Included is a timeline, weekly grading rubric, CAD Unit, Interactive Engineering Design Process guide, Safety Guidelines, Balsa Wood Bridge DesignChallenge, Daily Progress Slide section with instructions, Interactive Bridge Efficiency Tracking for a full class, and an extension activity section for 3D designs that can be created for stud
Preview of Marine Biology Ecosystem Math Project
Marine Biology Ecosystem Math Project

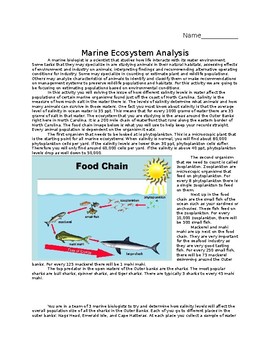
Students will use ratios to determine a population of sharks in the Outer Banks. This requires them to follow directions and find clues from a reading text and use of a picture to eventually come up with a end population.This is a wonderful activity for a dual curriculum project between science and math.
Preview of Finance Notes - Shark Tank Episode Guide!
Finance Notes - Shark Tank Episode Guide!

Student's love this mini lesson about Finance. The video guide is editable and a Key is included. The Key is for the episode that features the product Fresh Bellies. The episode is Season 10 Episode 13 on Hulu. You can use this resource with any episode! This Product is EditableBefore purchasing, please make sure you have the correct program for this resource. To edit the files, you should use microsoft office word, ppt...etc. (newer than 2008) or Google Docs, slides...etc. With Office 200
Preview of Types of Slope & Y Intercept: Interactive Distance Learning Google Classroom

Types of Slope & Y Intercept: Interactive Distance Learning Google Classroom

Created by
Raffi Sarajian
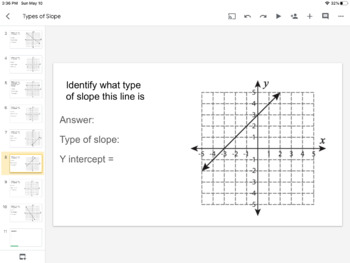
This is a great interactive online lesson which is compatible for google classroom and distance learning to help students get familiar with the different types of slope, (positive, negative, zero, undefined). Also the students will practice finding and Identifying the Y-intercept as well. Students will use the interactive activity to practice the skills required to move onto linear equations. Great tool to use to make a screen-cast video for your students!
Preview of Graphing speed -Middle School Physical Science Common Core Math 7
Graphing speed -Middle School Physical Science Common Core Math 7

Simple graphing of speed and calculating acceleration. Great for homework or classwork. Includes concepts on constant speed and acceleration in relation to the appearance of the graph. Could be used for a common core math; Ration and Proportinal Relatioships. Middle school graphing physical science speed acceleration Common Core 7th grade math
Preview of Graphing - Density Activity - Followup to Mass & Volume Activities

Graphing - Density Activity - Followup to Mass & Volume Activities

Created by
Fudge Factors
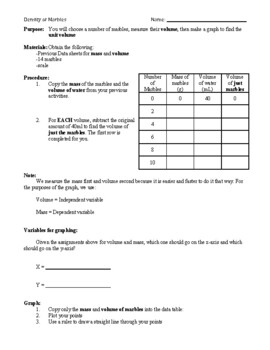
This is the third activity that takes data from the Mass Activity and Volume Activity to put them together to get the density of marbles. Students don't take any new data, but use their previous measurements of volume and mass to:1) create a Mass vs Volume graph, 2) draw a best fit line through their data,3) calculate the slope of the line, 4) write the equation of the line, and 5) use it to calculate the expected mass of 14 marbles to be compared to the actual mass of 14 marbles.For this activi
Preview of The Take Action Project - Projects & PBL
The Take Action Project - Projects & PBL

Created by
NextLesson
Driving Question:How can we take action to make a measurable difference to an energy, environmental, or food problem facing the world?Description:Students take action from grassroots to global, on an energy, environment or food-related issue of their choice. By starting small with things they can actually do, they measure the difference they made, and scale it up, ultimately connecting it to global issues. They 'sell' their action and issue with an ad campaign, using their own pictures, clips an
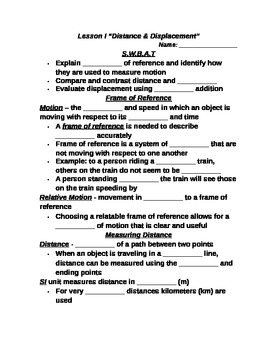
Preview of Lesson I Student PowerPoint Note Guide "Distance and Displacement"
Lesson I Student PowerPoint Note Guide "Distance and Displacement"

Created by
AstronomyDad
This lesson aligns with the Common Core State Standards: "STANDARD 6 - Force and Motion The competent science teacher understands and applies the concepts that describe force and motion and the principles that explain them. 6A. understands the concepts and interrelationships of position, time, velocity, and acceleration. 6E. describes and predicts motions of bodies in inertial and accelerated frames of reference and in one and two dimensions in a physical system with association to the basic th
Preview of DRIVING STEM Pendulum Swing - Forces & Motion, Time, and Gravity
DRIVING STEM Pendulum Swing - Forces & Motion, Time, and Gravity

Motion, Time, and Gravity: Investigate the pendulum, periodic motion, elapsed time, and load/mass/weight. Read "What Is a Second" before discussion and introduction of the challenge. Students will investigate length, load, and materials in order to design a pendulum constant and predictable motion. Essential Question: What determines the period of a pendulum? Recommended Level: 5-8 Time: Approximately 50 minutesPurpose: Introduce the concept of periodic motion. Students discover that the period
Preview of Rates & Proportions Breakoutbox / Escape Room - Animal Adaptations
Rates & Proportions Breakoutbox / Escape Room - Animal Adaptations

This activity connects science concepts of animal adaptations with math concepts involving rates and proportions. The breakoutbox/escape room consists of 4 locks that challenge students to work together. The four locks needed for this activity include:- 3 digit number lock- 4 digit number lock- Directional lock- 5 digit letter lock (capable of spelling 'SNAKE')This breakout box works best with a class period that lasts 40-45 minutes. Students will also need access to a QR scanner to access a Goo
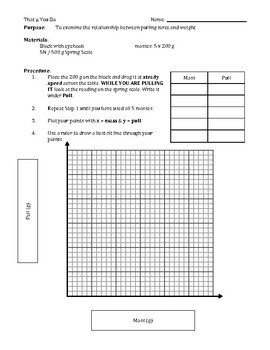
Preview of Graphing Activity - That Mu You Do - With Key
Graphing Activity - That Mu You Do - With Key

Created by
Fudge Factors
I do this activity with my freshman pre-algebra class to have them get experience with graphing "real data" points, then finding the slope of the "best fit line" and making meaning of what they did. A regular question in math class is "when am I ever going to use this?" This activity gives them something tactile to do with their hands that then makes the data points and the graph itself have real meaning for them and not just be numbers / dots on the page. I follow this activity up with "Graphin
Preview of Percent Change Activity: Growth in Plants over Time -- Proportionality Extension
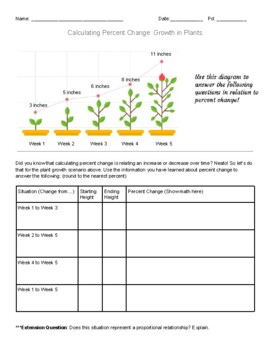
Percent Change Activity: Growth in Plants over Time -- Proportionality Extension

Created by
Teach-On Teacher
Students will get a real world situation where they can calculate percent change. This can be a formative assessment, an exit ticket, a warm up, or a mini lesson. Takes about 15-20 minutes with reflection. Includes answer key! Digital Easel activity included as well!Students will use the diagram to determine the percent change in growth of plants during certain intervals. There is also an extension question at the end to tie back the knowledge of proportional relationships and constant of propor
Preview of Metric Conversion Staircase 3D Foldable Manipulative Full Color Powers of Tens
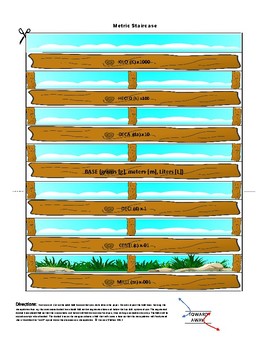
Metric Conversion Staircase 3D Foldable Manipulative Full Color Powers of Tens

Created by
Paper Power
This is a color version of my popular Metric Staircase Conversion Manipulative. Cut and fold to use this 3D graphic organizer as a manipulative tool in your science or mathematics classes to help students visually understand the process behind metric conversion. Along with teaching decimal manipulation, this manipulative will provide a concrete example of differentiated instruction that will prove to help your students understand that unit conversion is a scale that is exact and measurable. For
Preview of Graphing - Volume of Marbles - Proportionality constant, Slope-Intercept form
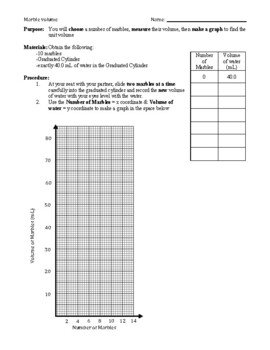
Graphing - Volume of Marbles - Proportionality constant, Slope-Intercept form

Created by
Fudge Factors
This is a hands-on activity that I do with both my General Science and Pre-Algebra classes. It ties experience of handling physical objects to concrete measurements of volume to abstract graph with finding and interpreting the slope.You will need to gather:1) Marbles of fairly consistent size (I got glass beads like these from the dollar store)2) 100mL Graduated Cylinders3) 40mL water for each GCThere are several skills practiced in this activity:1) Making precise measurements2) Data recording3)
Preview of Graphing - Mass of Marbles & Pennies: Notes, Proportionality Constant, Slope KEY
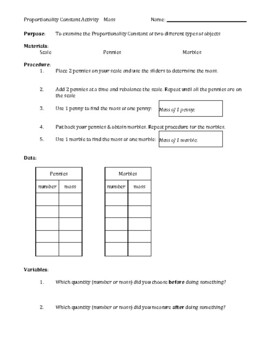
Graphing - Mass of Marbles & Pennies: Notes, Proportionality Constant, Slope KEY

Created by
Fudge Factors
This is a set of notes + activity focused on teaching students to connect a data table to a graph to slope of a line through the idea of 'Constant of Proportionality'. Students are to find the total mass of sets of pennies and marbles and then graph Mass vs Number. From a line on the graph, they will find the slope of the line and connect it to the mass of a single penny (and marble) in the analysis questions. This is the first in a series of 4 activities that focus on linear relationships betwe
Preview of How Big is a Googol, Trillion, Billion, etc... song
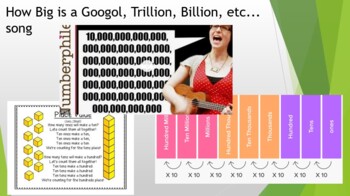
How Big is a Googol, Trillion, Billion, etc... song

Created by
3D-PT
Make learning about mind-bogglingly large numbers a fun and memorable experience with our "How Big is a Googol? Trillion, Billion, etc. Song." This engaging song resource is designed to captivate students' imaginations while helping them grasp the magnitude of numbers that often seem abstract and incomprehensible.I showed them the video of Helen Arnie's "Googol Song" in class to give them an idea of what I was looking for. Key highlights of the "How Big is a Googol? Trillion, Billion, etc. Song"
Preview of Converting d/t Graph to v/t Graph Worksheet
Converting d/t Graph to v/t Graph Worksheet

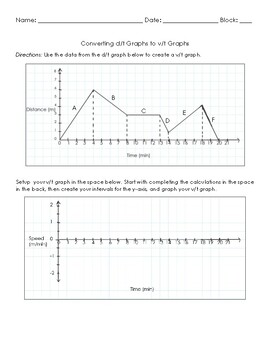
Worksheet that helps students understand how to convert a distance over time graph to a speed over time graph by calculating the slope of a constant rate/linear function. The worksheet is editable and does come with an answer key.
Preview of Build A Scale Model of the Solar System

Build A Scale Model of the Solar System

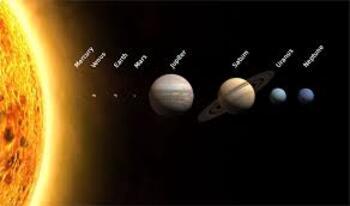
Objective:​ create a scale model of the solar system (planets only) showing -Part 1: The relative sizes (diameters) of the planets -Part 2: The relative distances of the planets from the sunMaterials 1 piece of paper [100cm x 50cm] scrap paper to cut upscissors metric ruler online resourcescompass mechanical pencil
Preview of Pokémon Go 6th through 8th Grade Cross Curricular Project
Pokémon Go 6th through 8th Grade Cross Curricular Project

Created by
Fun Math Sheets
Math, Science, PE/Health, Reading/Language Arts, Social Studies, Technology, Art, Music, and Social Skills are all included within this project. 13 pages includes teacher guide and student guide for the project, which uses the Pokémon Go app either as individuals or partners if some students do not have mobile devices. Also included are accommodations such as organizers and modification suggestions for special education or special needs students. Some inquiry based learning and activities are in
Preview of Cross Walk Rate Lab

Cross Walk Rate Lab

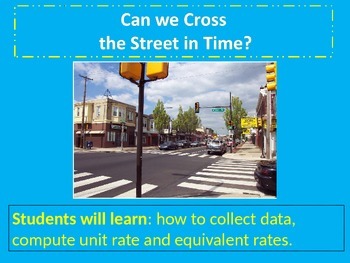
Can you cross the street in time? Attached is the lesson plan, student activity sheet, extension activities and PowerPoint with directions for both teacher and students.
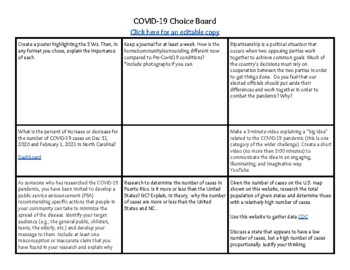
Preview of COVID-19 Choice Board

COVID-19 Choice Board

Created by
MissJonesJ
COVID-19 Choice Board.... cross curricular activites to understanding the virus. If your school does not have a subscription to NEWSELA you ay substitute your own text set.
Showing 1-24 of 30 results

Find Science resources | TPT

Importance of learning science

Learning science is particularly important for students as it equips them with the essential knowledge and skills to make sense of the world around them. Science education is not just about memorizing facts. It fosters critical thinking, inquiry, and problem-solving abilities. These skills are not only useful in school but also in everyday life beyond the classroom.

Benefits of learning science

Learning science offers many benefits to students both in school and beyond. In fact, it helps students:

  • Question the world around them and seek evidence-based explanations
  • Cultivate their ability to observe, experiment, and analyze data
  • Nurture a sense of curiosity, awe, and wonder about the natural world
  • Understand natural phenomena and the laws that govern the universe

With a solid foundation in science, teachers can help empower students to think critically, solve problems, make informed decisions, and engage with the world around them in meaningful ways.

Teaching with science resources

One of the best parts about science class is all of the possibilities for hands-on, collaborative learning! Think: labs, experiments, inquiry-based activities, and design challenges. These activities encourage students to explore scientific concepts by observing, asking questions, and conducting investigations. Additionally, with small group centers, students can engage in group experiments, discussions, and projects that require them to collaborate, share ideas, and solve problems together.

Discover printable and digital science resources

If you’re a teacher or parent looking for printable or digital science resources, TPT has an extensive array of instructional materials for every learning need, topic, or grade level. Whether you're learning about plant parts or butterfly life cycles, or exploring advanced topics like the anatomy of a cell or Newton’s laws of motion, we've got you covered.

On TPT, science resources come in various forms: from labs and worksheets to craftivities and doodle notes. They can be used to enhance learning, assess a student’s mastery of science concepts, or to reteach a tricky topic. With plenty of TPT resources at your fingertips, teaching and learning science will be so much easier. Plus, you can expand students’ knowledge even further by exploring TPT math resources, which are frequently paired with science lessons.

Frequently asked questions about teaching science

What types of science lessons are available on TPT?

There are many different types of science resources sold by Sellers on TPT. Some popular science lessons include biology, earth sciences, chemistry, environment, engineering, and anatomy.

How do I find science lessons on TPT?

Educators can save time preparing science lessons with resources created by experienced teachers. Simply start a search for science resources on the TPT marketplace, and filter by grade level, price, and/or resource type to find materials that've been proven to work in classrooms like yours. No matter what you’re teaching, there are plenty of science lessons and activities sold by Sellers on TPT that are tailored to meet your students' skill levels.

How can I make my science lessons fun and engaging?

Students learn best when they're engaged! Sprinkle a little fun into your science lessons and make them feel like real scientists by investigating everyday objects, exploring the world outside the classroom, and doing hands-on and collaborative experiments and design challenges.