6 results
Instructional technology Common Core 6.SP.B.5c resources
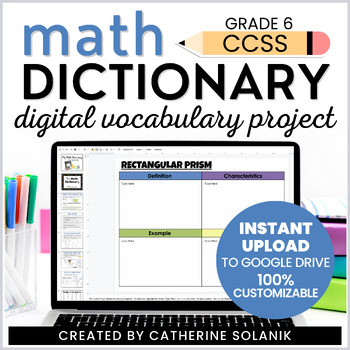
Grade 6 CCSS Math Dictionary Digital Resource Year-Long Math Vocabulary Project
Math vocabulary words not sticking? Need a system to help students learn and retain math vocabulary? How about a simple, easy-to-use system that goes beyond just memorization, is fun and engaging, creates student ownership, and is 100% paperless? Yes Please! My Math Dictionary is a year-long digital math vocabulary project created for Google Slides.As new or unfamiliar math vocabulary words are encountered throughout the school year, students complete the Frayer Model vocabulary templates which
Subjects:
Grades:
6th
Types:
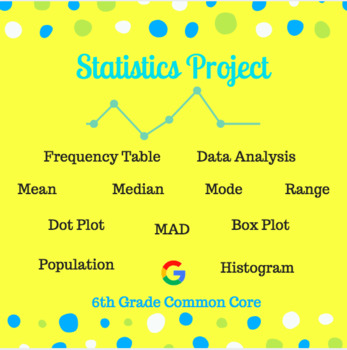
Statistics Project
Looking for an assignment that applies all you've taught about statistics? Well, then look no further! This is ready to print/share and go!! This document provides directions for students to follow to create their own statistics project. They are required to create a statistical question and then survey a population of 50 (fellow classmates, neighbors, etc.) Then, they must report their results in the form of a dot plot, box plot, frequency table, and histogram. After the data is represente
Subjects:
Grades:
6th - 9th
Types:
Also included in: Upper Grade Math Projects
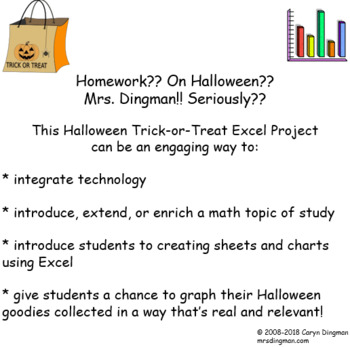
Excel Graphing Halloween Trick-or-Treat
Homework?? On Halloween?? Seriously??!!This Halloween Trick-or-Treat Excel Project, updated July 2018, can be an engaging way to:* integrate technology* introduce, extend, or enrich a math topic of study* introduce students to creating sheets and charts using Excel* give students a chance to graph their Halloween goodies collected in a way that’s real and relevant! This classroom-tested Halloween Excel project file includes: * student project directions sheet, in checklist form * rubric to score
Subjects:
Grades:
3rd - 6th
Types:
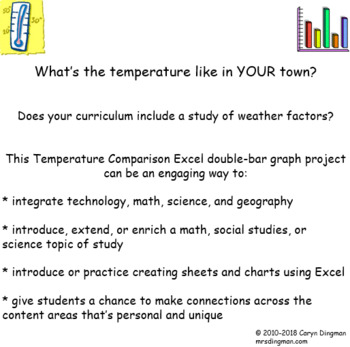
Excel Graphing Temperature Comparison
What's the temperature like in YOUR town? Does your curriculum include a study of weather factors? This Temperature Comparison Excel double-bar graph project can be an engagingway to:* integrate technology, math, science, and geography* introduce, extend, or enrich a math, social studies, or science topic of study* introduce or practice creating sheets and charts using Excel* give students a chance to make connections across the content areasThis classroom-tested project file includes: * student
Grades:
4th - 6th
Types:
NGSS:
5-ESS1-2
, 3-ESS2-1
, 3-ESS2-2
, 5-ESS2-1
, MS-ESS2-6
...
Excel Graphing Pulse Rate Comparison
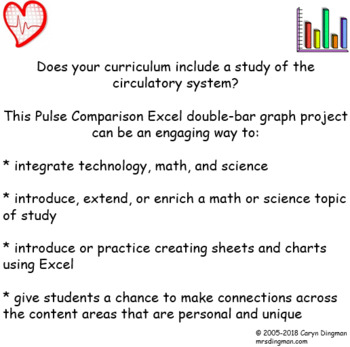
Does your curriculum include a study of the circulatory system? This Pulse Comparison Excel double-bar graph project can be an engaging way to:* integrate technology, math, and science* introduce, extend, or enrich a math or science topic of study* introduce or practice creating sheets and charts using Excel* give students a chance to make connections across the content areasStudents will be encouraged to wonder… Would the time of day and what we were doing affect our pulse rates?Pulses will be
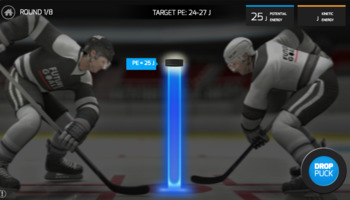
STEM Digital Resource for Grades 4-8
Future Goals - Hockey Scholar - Digital Simulations to Explore STEM - http://bit.ly/2zs0V5L
*2017-2018 Update - Now Available in Math and Science Editions*
Future Goals - Hockey Scholar™ brings science, technology, engineering, and math (STEM) concepts to life using the exciting, fast-paced game of hockey. Through immersive real-life simulations, students build their understanding of fundamental STEM concepts, such as geometric constructions, energy, and forces. In Hockey Scholar, each module
Subjects:
Grades:
4th - 8th
Types:
Showing 1-6 of 6 results

