5 results
Common Core 6.SP.A.3 lectures
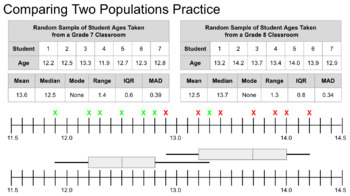
Grade 7 Statistics and Probability (Common Core/AERO) Presentations
This Bundle includes three Google Slide presentations.Each presentation addresses one of the Common Core/AERO standards for Grade 7 math in the domain of Statistics and Probability. Collectively, these presentations cover all grade 7 standards for statistics and probability as well as some of the 6th grade standards as review/scaffolding. The presentations were designed for these standards, but the content can be easily adapted to other courses.These presentations can be used to lecture but incl
Subjects:
Grades:
7th
6th Grade Math Quarter 3 - Coordinate Plane, Geometry
Full quarter of 6th grade level math lessons including integers, the coordinate plane and graphing, geometry including 2D and 3D, circles and spheres
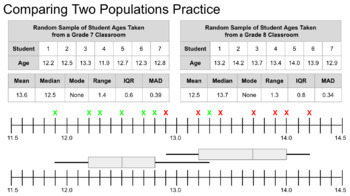
Statistics and Probability All 7.SP.B Standards Presentation (Common Core/AERO)
This is Google Slides presentation was designed to address all of the Grade 7 Math Common Core/AERO standards for 7.SP.A but the content is not at all specific to this course and can be easily adapted to other courses.In the name of scaffolding, several skills and standards from the Grade 6 curriculum are retaught in this presentation in order to give lower-level students a chance to catch up.This presentation covers:6.SP.A.2Understand that a set of data collected to answer a statistical questio
Subjects:
Grades:
7th
Also included in: Grade 7 Statistics and Probability (Common Core/AERO) Presentations
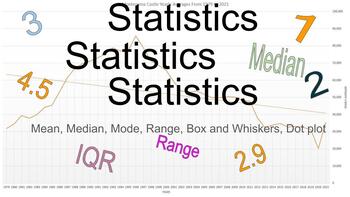
Statistics Unit
Fun with Box and Whiskers, Mean, Median, Mode, Range, Five Number Summary using anything from McDonald's food to M&M's with SKittles.
Statistics (Mean, Median, Mode, Box and Whiskers, with the five number summary
Teaching statistics to 6th graders can be an engaging experience by making the concepts relatable and visual. Five-Number SummaryThe five-number summary includes the minimum, first quartile, median, third quartile, and maximum. These values help summarize a set of data and are used in creating box plots. Start by having students collect a small dataset, such as their test scores, and calculate these five points to see how data is distributed.Box and Whisker PlotsA box and whisker plot (box plot)
Subjects:
Grades:
5th - 7th
Types:
Also included in: Statistics Unit
Showing 1-5 of 5 results

