9 results
Common Core HSS-ID.A.1 lectures
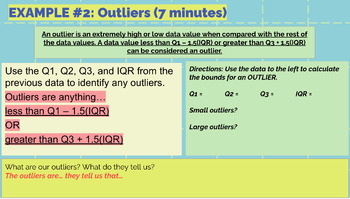
Lesson 2 PPT: One-Variable Data: Box Plots, Measures of Center and Variability
Hi! This is Part 2 of the lessons for One Variable Data for High School Statistics. Part 1 can be found on my product listings in my store. This lesson covers measures of central tendency (mean, median, mode), measures of variability (range, standard deviation, IQR), and how to create box plots. It includes guided practice during the lesson and think-write-pair-shares for students to engage in during the lesson.It's best downloaded into Google Drive and edited as you need for your class. If you
Subjects:
Grades:
10th - 12th
Types:
CCSS:

Organizing Data Using Frequency Distributions (Lesson with Homework)
Elementary Statistics - Organizing Data Using Frequency DistributionsCommon Core Aligned Lesson with HomeworkThis lesson plan includes:-Lesson Notes (PDF, PowerPoint, and SMART Notebook)-Blank Lesson Notes (PDF and SMART Notebook)-Homework (PDF and Word)-Answer Key (PDF)You do not need to have PowerPoint or SMART Notebook to receive the full benefits of this product. There are also PDF versions included!Lesson Objectives:-Organize data using a frequency distribution.Common Core Standards:S.ID.1
Subjects:
Grades:
10th - 12th, Higher Education
CCSS:
Also included in: Introduction to Probability and Statistics Lesson Plan Bundle
Graphs and Charts in Statistics (Lesson with Homework)
Elementary Statistics - Graphs and Charts in Statistics (Bar Graphs, Time Series Graphs, Pie Graphs, Stem and Leaf Plots)Common Core Aligned Lesson with HomeworkClick here for Histograms and Dot PlotsThis lesson plan includes:-Lesson Notes (PDF, PowerPoint, and SMART Notebook)-Blank Lesson Notes (PDF and SMART Notebook)-Homework (PDF and Word)-Answer Key (PDF)You do not need to have PowerPoint or SMART Notebook to receive the full benefits of this product. There are also PDF versions included!Le
Subjects:
Grades:
10th - 12th, Higher Education
CCSS:
Also included in: Introduction to Probability and Statistics Lesson Plan Bundle

Measures of Position (Lesson with Homework)
Elementary Statistics - Measures of Position (Quartiles and Five Number Summary)Common Core Aligned Lesson with HomeworkThis lesson plan includes:-Lesson Notes (PDF, PowerPoint, and SMART Notebook)-Blank Lesson Notes (PDF and SMART Notebook)-Homework (PDF and Word)-Answer Key (PDF)You do not need to have PowerPoint or SMART Notebook to receive the full benefits of this product. There are also PDF versions included!Lesson Objectives:-Find the measures of position in a set of data. (Quartiles)-Use
Subjects:
Grades:
10th - 12th, Higher Education
CCSS:
Also included in: Introduction to Probability and Statistics Lesson Plan Bundle

Algebra: Statistics Notes Packet
Complete notes packets with blank templates and answer keys that cover the following topics:
- Basic Stats definitions
- Box and Whisker Plots
- Stem and Leaf
- Frequency Histograms
- Cumumaltive Frequency Histograms
- Slope
Subjects:
Grades:
8th - 10th
CCSS:
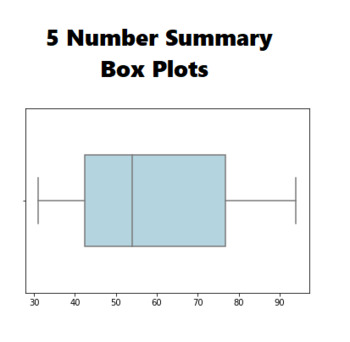
Statistics - 5 Number Summary and Box Plots (Lesson and Worksheet)
Contains a Power Point Lesson on finding a 5 number summary (Min, Quartile 1, Median, Quartile 3, Max) and making a box plot from a set of data.Covers the nuances of finding the quartiles when the median falls between two values or if the median is an exact value in the data.
Subjects:
Grades:
9th - 12th
Types:
CCSS:
Mean Median and Mode Power Point for Distance Learning
Students will love this colorful presentation of mean, median, mode and range. This google slides presentation can be used asynchronously or synchronously. Teacher answers are in the speaker notes of each slide. Great for flipped classrooms, classroom lectures, and online learning. There are 15 slides that include a lesson, checks for understanding and a quiz.
Subjects:
Grades:
6th - 12th
CCSS:

Showing 1-9 of 9 results

