3,304 results
Statistics lessons for products for TpT sellers
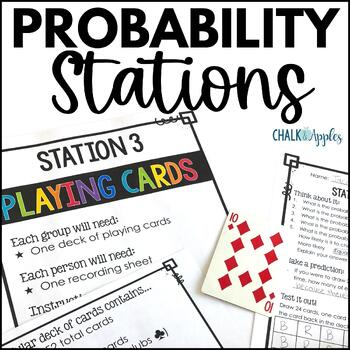
Chance & Probability Activities: Hands-On Theoretical & Experimental Probability
Make teaching probability exciting with these hands-on fun probability activities! This set includes 6 low-prep chance and probability stations perfect for exploring theoretical and experimental probability and critical thinking. Quick and easy setup plus clear student directions make these activities perfect for centers or substitute days, too!Lead your students to discover concepts of probability by exploring it on their own before teaching probability rules. Students will love exploring proba
Subjects:
Grades:
5th - 7th
Types:
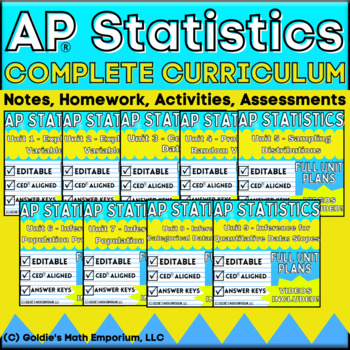
Goldie's FULL CURRICULUM for AP® Statistics
AP® Statistics Full CurriculumIn this product, you will receive all of Goldie's products related to AP® Statistics. All 9 units follow the College Board's© CED and include the following:Student Guided NotesStudent notes are "fill in the blank" style notes; teachers lead the lesson and work with students to complete the content. All content from the AP® CED is included and taught in the notes for this curriculum.Content VideosEach set of notes has a video to accompany it, where I teach the lesson
Subjects:
Grades:
10th - 12th
Types:
CCSS:
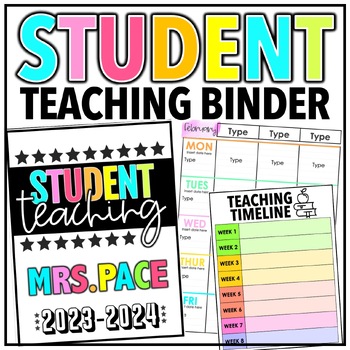
Student Teacher Binder 2023-2024
UPDATED FOR 2023-2024!Getting a student teacher? Prepare him/her for the best experience ever with a binder full of information, tips, and all things teacher-related! Pages included in this resource:binder covers - editable to add nameeditable student teaching timelineeditable daily schedule templatesweekly lesson plan pages (in a 2-page spread, choose from 2 different options)looking ahead lesson planning pagesimportant datescover pagesLesson Plans, Staff Meeting Notes, Student Information, Cal
Grades:
PreK - 6th
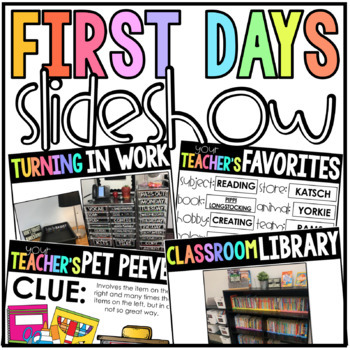
First Days Slideshow
The easiest way to ease back into a new school year after a long, summer break is this first days slideshow! Every detail you will ever need to cover with your students as they get back into the routines and procedures is included in this easy-to-edit document!The first week can be overwhelming - for the kids, but also for YOU! Creating and using this slideshow will be a built-in lesson plan for the first week back. When putting together my own slideshow, I map it around my day - when we will ne
Subjects:
Grades:
K - 6th

Goal Cards + Management Systems
Goal setting is a huge part of my classroom. I feel we all can work towards our full potential when we set goals, work to achieve our goals, and celebrate our successes! This system will help assist students in planning, working toward, and achieving their goals in the classroom setting!This pack includes:How-to-use informationGoal setting bulletin board letters; (GOALS framed letters as seen in my classroom)56 pre-made goal cards that fit the Target pocketsGoal tracking sheets (individual &
Grades:
1st - 8th
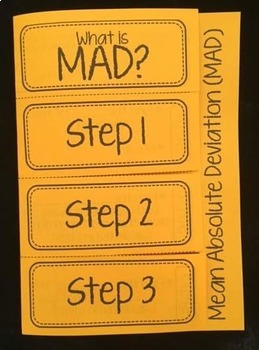
Mean Absolute Deviation MAD Foldable Notes
This editable foldable provides an introduction to Mean Absolute Deviation (MAD). Students will take notes on the meaning of MAD, the steps for finding MAD, and complete 1 example.This works great whole group/ guided instruction, in math centers, as a class work/ homework assignment, or even as an exit slip. Perfect for interactive math notebooks!Now with two options and an editable PowerPoint version!This product is also included in the following bundles:★ 6th Grade Math Foldable + Activity B
Subjects:
Grades:
6th - 7th
Types:
CCSS:
Also included in: Data Analysis and Statistics Foldable Bundle
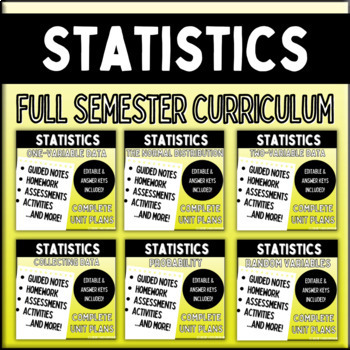
Statistics: FULL CURRICULUM BUNDLE
Statistics: Full Curriculum This is the FULL CURRICULUM bundle for my regular-level, Statistics course. If you are looking for my full curriculum for AP Statistics, follow the link here. This full curriculum is six units long and lasts 1 semester, approximately 90 school days. The following units are included in this bundle: Unit 1 – One-Variable DataUnit 2 – The Normal DistributionUnit 3 – Two-Variable DataUnit 4 – Collecting DataUnit 5 – ProbabilityUnit 6 – Random Variables Each unit contains
Subjects:
Grades:
11th - 12th
Types:
CCSS:
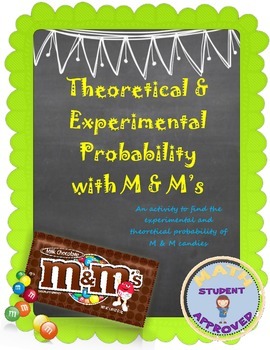
Theoretical and Experimental Probability M&M activity
Students need to find the probability of picking certain colored M&Ms, and asked to change them into decimals, fractions, and percents. They are asked to draw specific M&Ms at random for experimental probability problems. They are asked to make a few predictions, as well. This is a lengthy lesson and takes a while to get through, so make sure you have enough time to get through it. It can be done in 2 days, and if you need to use colored chips or counters instead, go for it!
Subjects:
Grades:
5th - 11th
Types:
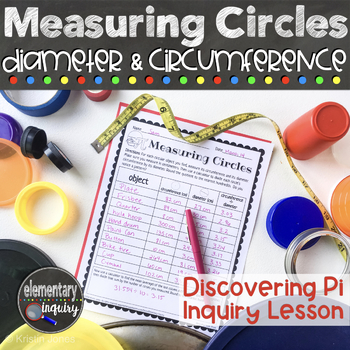
Measuring Circle Circumference & Diameter to Discover Pi - Pi Day Inquiry Lesson
Have fun finding Pi by measuring the circumference and diameter of circles of all sizes! Students will calculate the ratio of the length of a circle’s diameter to its circumference. They’ll discover that the circumference is always a little more than three times as long as the diameter. This full lesson plan and teacher script will help you lead an inquiry based investigation and class discussion. It’s perfect for an introduction to these geometry concepts, or for a fun Pi Day activity.A full, f
Subjects:
Grades:
5th - 7th
Types:
CCSS:
Also included in: Pi Day Activities - Measuring Circles Diameter, Circumference, and Area
Goldie’s AP® Statistics UNIT 4 PLANS – Probability and Random Variables
AP Statistics Unit 4 – Probability, Random Variables, and Probability DistributionsUnit BundleThis unit contains everything you need to teach "Probability, Random Variables, and Probability Distributions" in AP® Statistics or regular-level Statistics. Students will go through how to calculate and interpret basic probabilities, conditional probabilities, and probabilities for the union and interception of two events; represent and interpret the probabilities for discrete and continuous random var
Subjects:
Grades:
10th - 12th
CCSS:
Also included in: Goldie's FULL CURRICULUM for AP® Statistics
Goldie’s AP® Statistics UNIT 5 PLANS – Sampling Distributions
AP® Statistics Unit 5 – Sampling DistributionsUnit BundleThis unit contains everything you need to teach "Sampling Distributions" in AP® Statistics or regular-level Statistics. Students will go through how to calculate probabilities involving the normal probability distribution; calculate and interpret parameters, check appropriate conditions, and calculate and interpret probabilities of a sampling distribution for sample proportions (and a difference in sample proportions); and calculate and in
Subjects:
Grades:
10th - 12th
Types:
CCSS:
Also included in: Goldie's FULL CURRICULUM for AP® Statistics
Goldie’s AP® Statistics UNIT 1 PLANS – Exploring One Variable Data
AP® Statistics Unit 1 – Exploring One Variable DataUnit BundleThis unit contains everything you need to teach "Exploring One Variable Data" in AP® Statistics or regular-level Statistics. Students will go through how to represent quantitative and categorical data with various graphs and tables; find and interpret various measures of center and spread; and calculate and compare positions and percentiles in a normal distribution. This unit is part of my larger unit bundle: Goldie's AP® Statistics F
Subjects:
Grades:
10th - 12th
Types:
CCSS:
Also included in: Goldie's FULL CURRICULUM for AP® Statistics
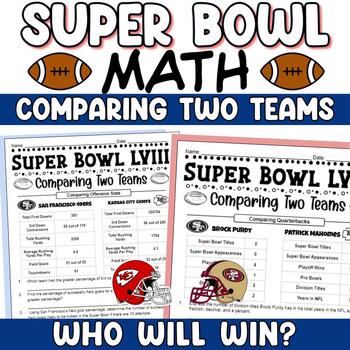
Super Bowl Math 2024 Comparing the Teams - Real NFL Super Bowl Stats
This Super Bowl LVIII Math activity is perfect for football lovers! It uses real-world statistics to compare the Kansas City Chiefs and San Francisco 49ers and asks students to form their opinion of the better team. Skills learned in early middle school are used to compare the quarterbacks, offensive stats, defensive stats and season records of San Francisco and Kansas City. Some of the skills assessed include measures of central tendency, decimals, fractions, percents, ratios, and proportions
Subjects:
Grades:
6th - 8th
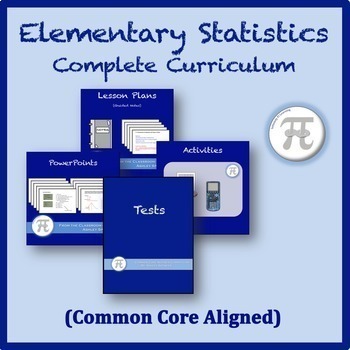
Elementary Statistics Complete Curriculum
VIEW FULL PREVIEW VIDEO HERE: https://youtu.be/eRPmKXVrmw4*Video Note: This video was made before changing to the bundle format, so the setup is a little different. Each section is an individual zipped file instead of being organized into folders. Quizzes and other extras can be found in the Bonus Content folder.Elementary Statistics Complete Curriculum (One Semester)This bundle includes everything in my Elementary Statistics Curriculum.The Complete Curriculum Includes:-Lessons with Lecture Note
Subjects:
Grades:
10th - 12th, Higher Education
Types:
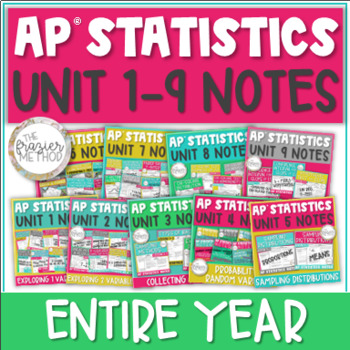
AP Statistics Notes Curriculum ENTIRE YEAR Units 1-9 Notes with Keys
121 PAGES of AP Statistics Notes to teach through ALL 9 UNITS over the ENTIRE YEAR in your AP Stats class! Histograms, box plots, scatterplots, linear models, residual plots, linear regression computer output, sampling methods, bias, experiment design, probability rules, random variables, binomial distributions, sampling distributions of proportions and means, chi-square distribution, confidence intervals, hypothesis tests, TI-84 Plus CE calculator functions, and so much more! Aligns with the AP
Subjects:
Grades:
10th - 12th
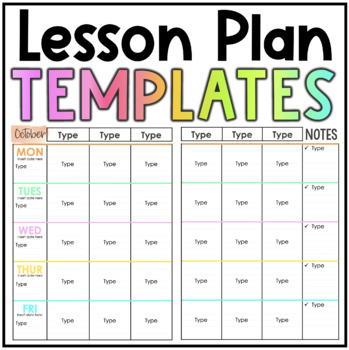
Lesson Planning Pages
Needing a user-friendly template to write your weekly lesson plans? Or maybe you need them for a student teacher? These lesson plan templates come with the following options:color 2 options available; days of the week at the top or down the sides2-page spread by monthAlso available in Google Slides for easy collaborating with colleaguesFollow along with my classroom, teaching, + happenings on IG at @misswestbest!Any questions, don't hesitate to read out to misswestbest@gmail.com!Thank you!
Subjects:
Grades:
PreK - 6th
Types:
Goldie’s AP® Statistics UNIT 6 PLANS – Inference for Proportions
AP® Statistics Unit 6 – Inference for Categorical Data: ProportionsUnit BundleThis unit contains everything you need to teach "Inference for Categorical Data: Proportions" in AP® Statistics or regular-level Statistics. Students will go through how to justify conditions, calculate, interpret, and justify a claim about a confidence interval for a population proportion; identify the relationships between sample size, the width of a confidence interval, confidence level, and margin of error for a po
Subjects:
Grades:
10th - 12th
Types:
CCSS:
Also included in: Goldie's FULL CURRICULUM for AP® Statistics
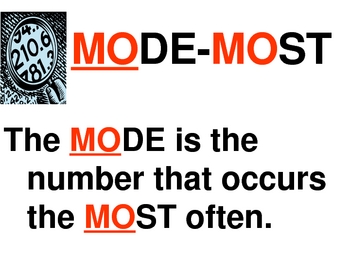
Statistics Mean, Median, Mode & Range Interactive PowerPoint by Erica
Introduce statistics including mean, median, mode and range with this colorful, interactive 22 slide PowerPoint. This interactive PowerPoint introduces each term and teaches a strategy for finding the value. There is also a trick or visual to help students remember the steps to find each one (mean, median, mode and range). Students are able to practice finding the mean, median, mode and range and then check within the PowerPoint. This is excellent for a statistics lesson or for students to e
Subjects:
Grades:
3rd - 6th
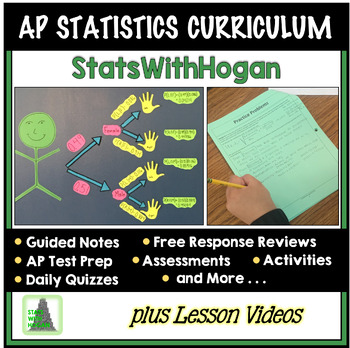
AP Statistics Curriculum Mega Bundle (with videos of each lesson)
This Bundle contains everything you will need to prepare your students for success on the AP® exam.I have designed these lessons over the past 12 years teaching AP Statistics. The organization and rigor of the lessons and practice have produced an AP pass rate well over the national average.I am redesigning the notes to make improvements including power point slides and keynote to present lessons. The upgrades will be free to those who have purchased this bundle. The curriculum was redesigned i
Subjects:
Grades:
9th - 12th, Higher Education
Types:
Goldie’s AP® Statistics UNIT 3 PLANS – Collecting Data
AP® Statistics Unit 3 – Collecting DataUnit BundleThis unit contains everything you need to teach "Collecting Data" in AP® Statistics or regular-level Statistics. Students will go through how to identify types of studies, sampling methods, and sources of bias in a study; compare and interpret the components of a well-designed experiment; and explain why a particular experimental design is appropriate. This unit is part of my larger unit bundle: Goldie's AP® Statistics Full Curriculum This produc
Subjects:
Grades:
10th - 12th
Types:
CCSS:
Also included in: Goldie's FULL CURRICULUM for AP® Statistics

Taylor Swift Eras Tour - Google Slides Theme
Transform your daily teaching slides with this unique Eras Tour Theme. Featuring 75+ slides of fully customizable content, this set is great for any grade level teacher. Each of the 10 eras is represented through colors and fonts. This set includes preloaded templates for each day of the week and several blank templates to make your own. Quickly apply embedded layouts when adding new slides to your deck.Includes the following layouts:MondayTuesdayWednesdayThursdayFridayWeek at a GlanceTwo Column
Grades:
Not Grade Specific
Also included in: Taylor Swift Eras Tour - Ultimate Classroom Bundle
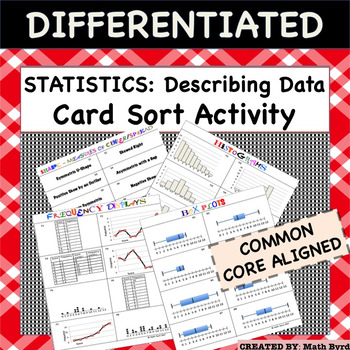
Statistics:Representing & Interpreting Data (Histogram, Box Plot, Dot Plot)
Complete Lesson! This lesson features a 40 CARD SORT, Differentiated Cornell Notes, Distribution Shapes Graphic Organizer, and Power Point to go with the notes! Perfect for the inclusive classroom! Within the Card Sort Activity there are 5 categories of cards to match: 1) Histogram2) Frequency Display (including Dot Plots, Frequency Line Graphs and Tables)3) Box Plots4) Describing Shape5) Describing Measures of Center & Spread. With 8 different sets of matches, there are 40 cards total. Stud
Subjects:
Grades:
8th - 12th
Types:
CCSS:
Also included in: Common Core Algebra 1 CARD SORT ACTIVITIES - BUNDLE PRICE!
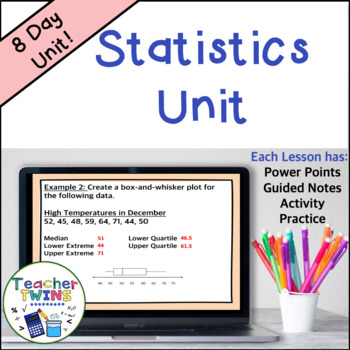
Statistics Unit - Mean Absolute Deviation - Populations and Samples - Box Plots
Make lesson planning easy with this no-prep Statistics - Mean Absolute Deviation - Populations and Samples - Box-and-Whisker Plots Unit! Included are 8 ready-made lessons to teach finding mean absolute deviation as well as interpreting and creating box-and-whisker plots. This unit is very easy to use and will save you a lot of time! Your students will learn how to find mean absolute deviation and interpret box-and-whisker plots by using our editable PowerPoints with guided notes. Students will l
Subjects:
Grades:
6th - 8th
Also included in: 7th Grade Math Curriculum Bundle
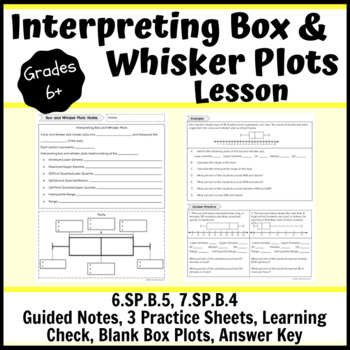
Interpreting Box and Whisker Plots Lesson- Notes, Practice, Learning Check
This interpreting box and whisker plots lesson consists of a guided notes sheet, 3 practice sheets, a learning check, 2 different half sheets of blank box plots and an answer key. You can hole punch the note pages and have students place them in their binders or a 3-prong folder. There are teacher notes to guide you through the direct instruction with students. There are three pages of practice. One page can be used as independent practice when students are ready; this could be in class or homew
Subjects:
Grades:
6th - 10th
Types:
Showing 1-24 of 3,304 results

