9 results
Common Core 8.SP.A.4 laboratories
Exploring Tides. Graphing Data and Patterns Project
This activity helps students to see the connection between the moon phases and the height of Tides. In this activity students are required to graph the height of the highest tides and the lowest tides of each day given. Then they compare that with the calendar for the new and full moons. The patterns help them discover the relationship between moon phases and tides. Excellent reinforcer of graphing skills with a science connection.
Grades:
5th - 9th
Types:
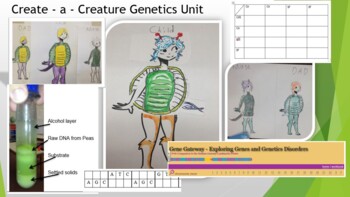
Create - a - Creature Genetics Unit
This whole unit covers the basics of genetics! It includes the Create a Creature lab, home genetic test, Punnet Squares, webquest, and final test!You can also extract DNA from dried peas; practice reading DNA and RNA; explore genetic disorders through the Human Genome Project webquest; and explore pedigree charts! You will have to create your own shell and tail pieces this. The original artist has gone on to draw a Google doodle ! You can also have the students design their own shell / tails. Th
Subjects:
Grades:
7th - 12th, Higher Education, Adult Education
Types:
NGSS:
HS-LS3-3
, HS-LS3-1
, MS-LS4-3
, MS-LS4-1
, HS-LS4-2
...
Also included in: Hands-on Science Semester Labs Bundle
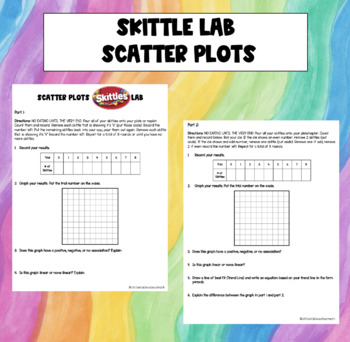
Skittles Lab - Scatter Plots
In this lab, students will be creating data that they can use to create scatter plots and either demonstrate their understanding of scatter plots or discover new learning about scatterplots. Students will be creating two different scatter plots based on their skittles in their cup. They will follow directions and plot the data they create. The first part has students analyzing the trend of their data (positive, negative, no association) and describing the shape of the data. The second part of t
Subjects:
Grades:
7th - 9th
Types:
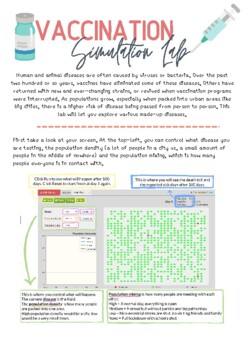
COVID-19 Simulation Lab
Students go to the following website and follow the guide to answer the questions. They look specifically at why social distancing and staying at home works, how population density affects the spread of a virus and how vaccinations can slow the spread. They will answer questions about their thoughts on vaccinations and if they should be required to have one. Website: https://www.learner.org/wp-content/interactive/envsci/disease/disease.html
Grades:
5th - 12th
Types:
NGSS:
HS-LS4-6
, HS-LS4-3
, MS-LS4-4
, MS-LS4-6
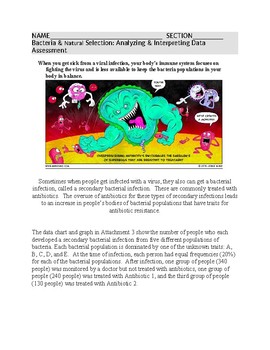
Analyzing Natural Selection Data of bacteria-Middle School NGSS
Focus on the NGSS cross cutting concept of analyzing data for DCI SCI-MS-LS4-6Students will analyze and interpret a data table and graphical representations of bacteria trait data associated with antibiotic resistance. Students will be able to use data to make predictions, and write a scientific argument for which trait would be the antibiotic resistant bacteria based on data.
Subjects:
Grades:
6th - 12th
Types:
People Perfectly in Proportion: The Golden Ratio
Zip File includes - PDF and editable documentLesson Setup: This lesson can be used for students at all developmental levels. Measuring with a ruler, error analysis, and proportional thinking are a few of the skills this lesson practices. Groups can be made based upon skill requirements. Lower functioning students can perform measurements and watch higher performing students do calculations. Result could also be presented by a possible third student - if you want to do trios as opposed to pa
Subjects:
Grades:
3rd - 12th, Adult Education
Types:

Box and Whisker Plot, Scatterplot, Histogram, Stacked Bar Graph of Hurricanes
A Word doc, for customization, of an independent/small-group activity involving an article from NOAA weather, to read, analyze, and draw conclusions based on graphing of real data from NOAA involving hurricanes by decade. Student(s) will make a box plot (box and whisker plot), scatterplot, histogram, and stacked bar graph to support or disagree with the article presented.An Excel sheet with solutions of graphs is provided.Student(s) can work on this independently or in small groups, using graph
Subjects:
Grades:
7th - 8th
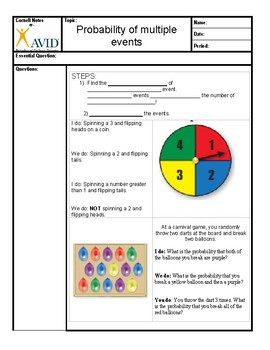
Bean Boozled Probability lab and Cornell Notes
This product is a lesson in probability using Bean Boozled. Buy the beans and let students calculate the probability of getting a yucky flavor! The Powerpoint presentation is to accompany is below.Bean Boozled Powerpoint PresentationBean Boozled Bundle
Subjects:
Grades:
5th - 8th
Also included in: Bean Boozled Probability Bundle
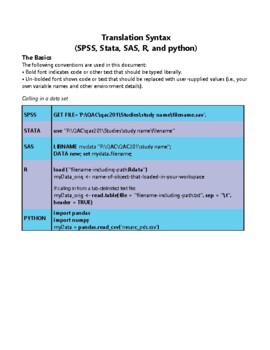
STATA software Secondary Data Analysis
This handout is intended for those interested in teaching/learning basic introductory statistics concepts to analyze real data. Students will learn how to tell a story using secondary data analysis. The handout is for STATA software and the US Longitudinal Study of Adolescent Health data set. For handouts on setting up an account, the data set code book and raw data file, a PowerPoint to accompany the handout, or questions please email kristin.flaming@gmail.com or ldierker@wesleyan.edu.This
Grades:
6th - 12th, Higher Education, Adult Education
Types:
Showing 1-9 of 9 results

