61 results
Graphing laboratories $5-10
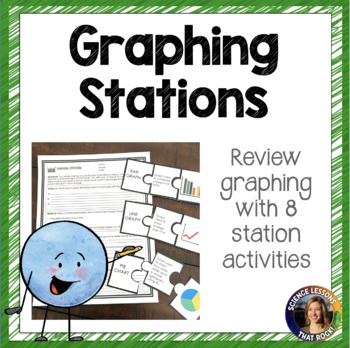
Graphing Station Activity
Included in this activity are 8 stations that are centered around graphing. The lesson is 17 pages and non-editable. See description below of each station and required materials.Station 1: At this station students determine which type of graph should be used based on 3 data sets. No additional materials are needed. Station 2: At this station students will create a best fit line and calculate slope. You will need to slide the page into a page protector, and provide a ruler, whiteboard marker, and
Subjects:
Grades:
8th - 10th
Types:

Beaker Pong: Experimental Design and Graphing Lab, NGSS aligned
Great 1st week or 1st month STEM activity! All parts are EDITABLE and includes a graphing grid! This is a great way to introduce the "science process" (better phrase for scientific method) at the start of a semester or anytime you want fun to occur in your classroom.*****Focus on the NGSS PRACTICES Dimension*****The National Research Council's (NRC) Framework describes a vision of what it means to be proficient in science; it rests on a view of science as both a body of knowledge and an evidenc
Subjects:
Grades:
7th - 12th
Types:
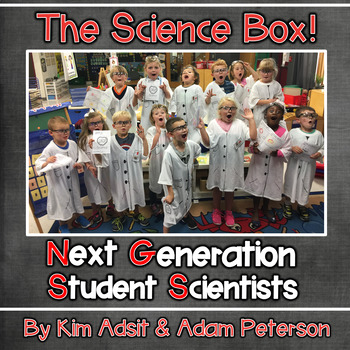
The Science Box - Next Generation Scientists by Kim Adsit and Adam Peterson
This unit, The Science Box, by Kim Adsit and Adam Peterson, provides experiences to develop the Next Generation Science Standards. In this unit you will find directions to build excitement for science through a “scientist uniform” and a special celebration. It includes anchor charts for each step in the scientific method that can be used to guide your lessons. 6 different science activities for the weekly science box are included. For each activity you will find:· A Supply List· A Letter from Dr
Subjects:
Grades:
PreK - 1st
Types:
Middle School Scientific Method Unit - Notes, Labs, Activities, Test
This 70-page unit includes 7 lessons taking place over 4-5 weeks to teach your middle school students about the scientific method. Each lesson includes teaching notes, links to any supplemental materials (notes slideshows, videos, etc.), and student materials (notes, activities, labs, project outline, test, etc.). This includes two full labs, 3 sets of scaffolded notes, 9 classroom activities, a science fair project, and a unit test.Lesson 1 - Introduction to the Scientific Method activity - stu
Subjects:
Grades:
6th - 8th
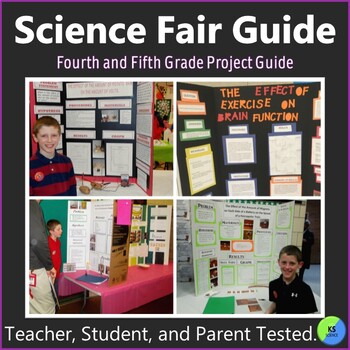
Science Fair Project Guide | Experiment Journal and Worksheets For Grade 4 And 5
A step by step science fair guide with workbook pages, tips, blank science journal, and poster board layout. It helps fourth and fifth graders create age-appropriate experiments with less parental guidance. Teachers can use as a classroom unit on the scientific method, science processes, and to help complete a whole-class project. We will help make the science fair a fun and rewarding experience.Don't be nervous when your child says they want to participate in the science fair.Nervous about pl
Subjects:
Grades:
4th - 6th, Staff
NGSS:
3-5-ETS1-3
Scientific Method NGSS Crosscutting Concepts Activity & PowerPoint
Students will have a great time learning about science skills, experimental design, NGSS Cross Cutting Concepts, and NGSS Science and Engineering Processes with this resource! And it's Google Ready! It's packed with teacher notes to make your job easy!All you need are two tennis balls per group, one meter stick per group and something to keep the tennis balls cold like a cooler or freezer. The data really shows the difference between the bounce of a cold tennis ball and a room temperature ball.
Subjects:
Grades:
5th - 12th
Types:
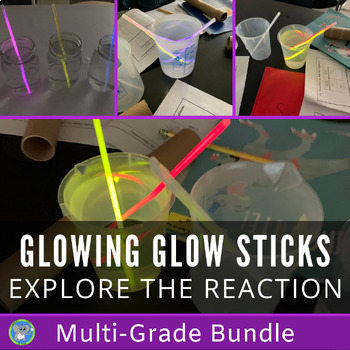
Chemical Reaction Bundle | The Science Of Glow Sticks | Light Activity
Engage students with the science of glow sticks. All grade levels teach the same concept but differentiate by age and abilities. This enables a teacher to teach the same concept at the same time. Great for the science lab teacher and homeschool family. By purchasing this bundle, you are SAVING 20% off each individual resource.Digital and Distance Learning Approved. This experiment uses simple supplies and can work well for a distance learning or digital activity. The teacher can perform the
Subjects:
Grades:
Not Grade Specific
NGSS:
5-PS1-3
, 5-PS1-4
, 2-PS1-4
, 4-PS3-3
, 2-PS1-1
...
MS-PS4-1 Mathematical Models of Waves Lab | Printable, Digital & Editable
About SNAPs Lab Stations ActivitiesSNAPs Lab Stations Activities require students to use science, math, literacy, problem-solving and engineering skills. They are designed to enhance students' understanding of scientific concepts and help students apply scientific ideas to the real world. Each station activity promotes skills so to develop students into proficient and competent scientific thinkers.SNAPs lab activities have five components:• Science Skills Station to develop science skill profici
Subjects:
Grades:
5th - 9th
Types:
NGSS:
MS-PS4-1
Also included in: Physical Science Lab Stations Bundle | Printable, Digital & Editable
Spring into Statistics Data Displays and Measures of Center Lab
This is a hands-on lab that teaches about Statistical Questions, Data Displays (dot/line plot, histograms, box plots) and Measures of Center (mean, median, mode, and range). The lab includes notes pages, examples with answer keys, and a final project in which the student can survey classmates and create a "flower" by using their data to find mean, median, mode, range. They will also create a box plot, histogram and dot plot.
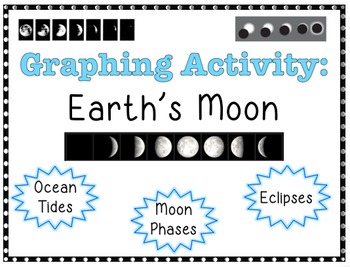
GRAPHING ACTIVITY Earth's Moon
This is a great way to incorporate graphing into a unit about Earth's Moon. Students will construct a total of 6 graphs (2 line graphs and 4 bar graphs) using data provided. Each part has questions to help students analyze the graph(s), apply information, and draw conclusions.
Part 1: Phases of the Moon
- Students will construct a line graph the percent of the illuminated part of the Moon seen from Earth each day for 1 month.
Part 2: Ocean Tides
- Students will construct a line graph for the
Subjects:
Grades:
8th - 12th
Types:
Weather LAB: Greenhouse Effect (A Must have for Combining Science and Math!)
PROCEEDS BENEFIT "REACH INC."-EMPOWERING ADULTS WITH DISABILITIES
http://www.reachinc.org
-Southern Science Specialists - Chapel Hill, North Carolina-
A MUST HAVE!
The Greenhouse Effect – one of the MOST MISUNDERSTOOD concepts in Earth Science. This LAB is a MUST HAVE! See PREVIEW!
A great blend of math (calculations and graphing), meteorology, physical science, and the scientific method.
No Materials? NO Problem! Students can complete this lab with the recommended materials or without u
Subjects:
Grades:
5th - 10th, Higher Education
Types:
Rocket Math | Geometry, Protractor, Averaging, Measurement STEM
Rocket Math includes step-by-step instructions to building and launching foam rockets. Your students collect, average and analyze the data to find the optimum launch angle. Included are a graphing template so that the instructor can enrich the lesson by graphing variables. Students will explore measurement, angles, averaging, recording data, geometric terms, scientific method using variables, and graphing. Included in the Rocket Math download:*Step-by-step instructions with photos for building f
Subjects:
Grades:
3rd - 8th
Types:
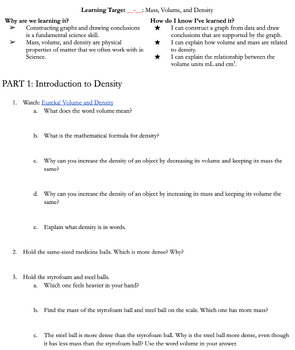
Mass, Volume, and Density Graphing Activities (Editable Doc)
There are so many ways to teach density it can be overwhelming to choose what to do. This is the best way I have found to teach it in my 10+ years of teaching Science. This lesson helps students learn so many things at the same time! It gives students:An introduction to the physical properties mass, volume, and densityAn introduction to water displacement to measure volumeAn opportunity to practice making measurementsAn opportunity to practice graphing data they collectAn opportunity to practice
Subjects:
Grades:
8th - 12th
Types:
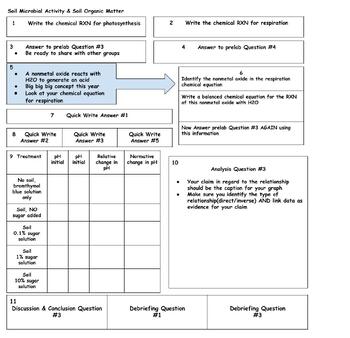
AP Environmental Lab Poster Template, Soil Microbial Activity & Organic Matter
Poster templates are designed to accompany the labs for the AP Environmental Science Course. As teams of students conduct the labs, they constantly document information they collect from the prelab, data collection, and the analysis portion. A template for students to follow is presented and as a team complete the poster. I generally have them make posters on butcher paper and we hang them in the hall as a resource they can look at throughout the year. They were also a great review tool this
Subjects:
Grades:
11th - 12th
Types:
CCSS:
NGSS:
HS-ESS3-2
, HS-ESS3-6
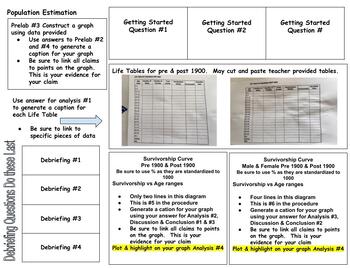
AP Environmental Lab Poster Template, Population Estimation
Poster templates are designed to accompany the labs for the AP Environmental Science Course. As teams of students conduct the labs, they constantly document information they collect from the prelab, data collection, and the analysis portion. A template for students to follow is presented and as a team complete the poster. I generally have them make posters on butcher paper and we hang them in the hall as a resource they can look at throughout the year. They were also a great review tool this
Subjects:
Grades:
11th - 12th
CCSS:
NGSS:
HS-LS2-1
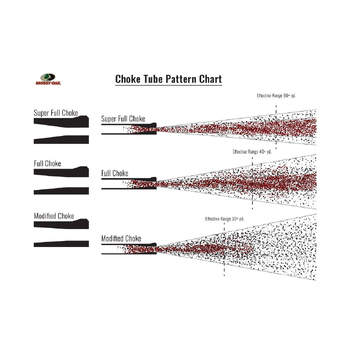
Ballistics Shotgun Spread Lab
Depending on the type of choke a shotgun has or the size of the shot (pellets fired) itself, the shot will disperse in a very predictable pattern. It will disperse in a circular pattern, and that pattern's diameter will change depending on how far away the target was.In this lab, the students will learn about the different types of chokes and how they disperse their shot. They will then do the following:Measure shot diameter from different chokes and shot diameterScale up these measurements from
Subjects:
Grades:
9th - 12th
Types:
StayGiant Candy Mix Bundle: Lab Investigations
All of the materials including in this bundled Strategic Instruction download are available as individual products sold separately on TpT in the ScienceGiant store. Please click on each link to receive a detailed description. [BE ALERT TO STUDENT’S FOOD ALLERGY WARNINGS! Products may contain nut and other allergens].Teachers use the Strategic Instruction Model (SIM) Framing Routine to transform abstract main ideas and key topics into a concrete representation that helps students think about and
Subjects:
Grades:
6th - 12th
Types:
EDITABLE Excel Graphing Template
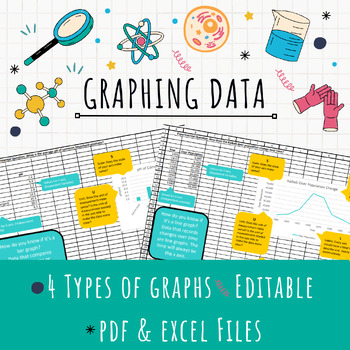
Teach graphing in Excel with this EDITABLE template! After collecting data, have your students represent it in a formal graph using Excel. This template provides helpful tips for students to determine the right kind of graph (bar, line, or pie) for their data and ALSO teaches them all the important parts of a graph.Assign the template for students to download and edit for a quick graphing solution or provide the pdf handouts for students who just need a little guidance!4 different kinds of graph
Grades:
7th - 12th
Types:
Graphing with SULTAN
To teach my students to create excellent graphs in their labs and experiments, I use the acronym SULTAN. It is a simple 6 point checklist rubric to ensure that graphs in science are created clearly and accurately. SULTAN stands for:ScaleUnitsLabelsTitleAccuracyNeatnessI find this to be a clear, concise way to help students capture the key elements of an effective graph. It also makes for a handy rubric and way to provide quick targeted feedback on student graphing skills once they know SULTAN
Subjects:
Grades:
5th - 10th
Types:
Flying Pennies Simple Scientific Method Lab (ENGLISH, SPANISH, ESOL, SPED)
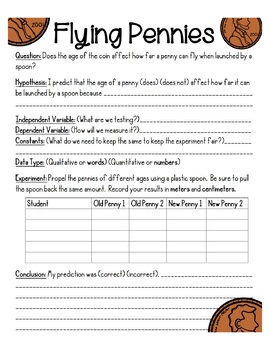
Simple Lab to help you teach the scientific method and get your students enthusiastic about the scientific process. Use materials you have lying around your classroom to create an engaging, cross curricular lesson with graphing!4 Levels of Differentiation, English and Spanish Versions included in this bundle.DIRECTIONS Flying Pennies time: 30 minutes, full activity 60 minute class period o You will Need: A bunch of older pennies and a bunch of newer pennies. A box of plastic spoons. (Protr
Subjects:
Grades:
4th - 6th
Types:
Plant Observation Book
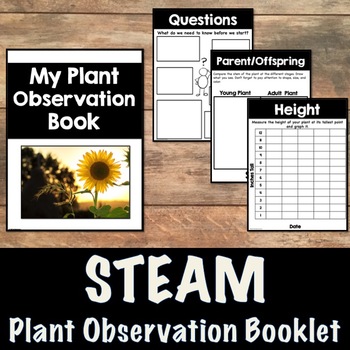
This student book integrates science, math, art, and writing as the students sketch, measure, and graph plant growth. This book comes with pre-set bar graphs and blank bar graphs for the students to fill in depending on what units of measurement they use and what days they measure their plants. This book goes along with the real life project of growing plants from seeds and observing the changes.
Next Generation Science Standard: 1-LS1-3: Make observations to construct an evidence based accoun
Subjects:
Grades:
1st - 4th
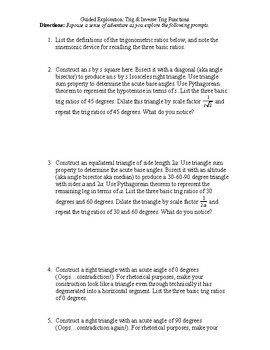
Guided Exploration: Trig & Inverse Trig Functions
35-item teacher-lead inquiry into properties and behavior of Trigonometric/Inverse Trigonometric Functions. Best used at the beginning of a unit on trigonometric/inverse trigonometric functions (before demonstrating how to solve textbook problems), this activity invites students to use inductive reasoning and class discussion to discover the big ideas behind graphing trigonometric/inverse trigonometric functions without a graphing utility.
Subjects:
Grades:
10th - 12th
Types:
CCSS:
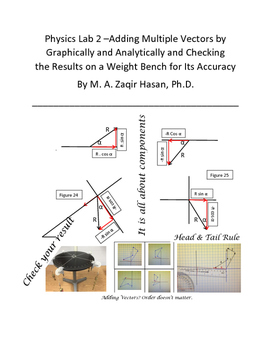
Physics Lab 2 - Adding Multiple Vectors by Graphical and Analytic Methods
The best lab you can do to teach your students how to add multiple vectors by graphical and analytic method. It shows the graphical method of adding vectors in step-by-step method starting from selecting the scale.
The graphical method is followed by the analytic method in great detail. An extensive discussion is available in breaking a vector in to two components perpendicular to each other. Students usually find it difficult to break a vector in its components.
Finally, the result is verified
Subjects:
Grades:
10th - 12th
Types:
Wild and Wacky Weather
A wonderful weather unit that I have used in grades 2-5 over the years. Language arts, math, and science all rolled into one unit!
File includes:
Activities for Cloudy with a Chance of Meatballs
Temperature Math Task Cards
Poetry Writing
Measuring Dew Point
Rain in a Bag (also sold separately)
Wild and Wacky Weather Data Collection
Wild and Wacky Weather Graphing
Cloud activity and labels
Generic Lab Sheet for any science experiment based on the Scientific Method
Word Wall vocabulary cards, per
Subjects:
Grades:
2nd - 5th
Showing 1-24 of 61 results


