10 results
7th grade algebra 2 simulations
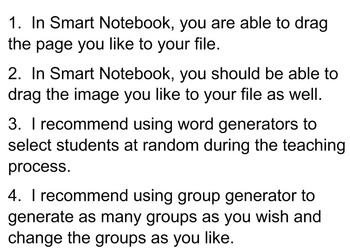
FREEBIE - Templates: Group Generator, Name Chooser, Timer, Activity, ... etc.
This Smart Notebook file contains tools that are helpful to use in managing the classroom. A "Group Generator" tool allows you to generate as many groups as you wish. A "Word Chooser" tool allows you to pick on a student for an answer at random. A "Timer" allows to manage your class time effectively. Different type of timers are also included such as firecracker. Also, for those who are teaching probability, an interactive die, spinner, and card are also available in this template file.
Si
Subjects:
Grades:
PreK - 12th, Higher Education, Adult Education, Staff
Types:
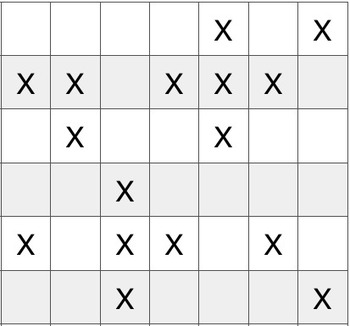
Vector Game - Mine Maze
The Mine Maze game combines movement with Vectors (magnitude & direction) with the Unit Circle directions. Students will navigate themselves through a maze of hidden mines while using vectors. The first to traverse the entire board wins! WORKS BEST IF YOU MAKE A BOARD OUT OF TAPE ON THE FLOOR! Directions to the game are included, as well as an audio clip that explains the instructions and gameplay. Feeling creative? This game is very flexible, and allows for use at many different grade level
Subjects:
Grades:
7th - 11th
Types:
CCSS:
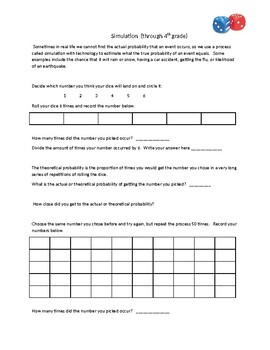
Probability Intro to simulation using dice
This is the perfect introductory activity to simulation and probability. It could be used in Algebra 2 and basic Statistics courses. It could also be used in 6th through 8th grade to introduce probability.
Subjects:
Grades:
6th - 12th
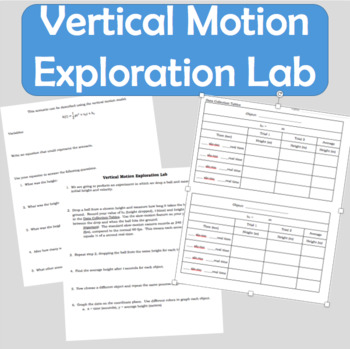
Vertical Motion Exploration Math Lab - Discovering through Inquiry
Do you have those students that always ask about how this relates to real life? This math lab is the solution. Students will work through an experiment just like they would in science class to discover through self-inquiry that vertical motion is best represented with parabolas and quadratic functions. The experiment allows students to discover this phenomena through inquiry and data collection. After collecting data, students will have their "a-ha" moment. Students will quickly be able to
Subjects:
Grades:
7th - 12th, Higher Education, Adult Education
Types:

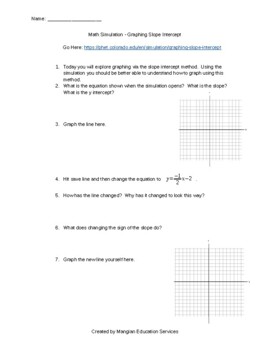
Virtual - Slope Intercept Learning Simulation
Using the simulation by phet, students can better understand how changing the slope and y intercept change their graphs.
Subjects:
Grades:
7th - 10th
Types:
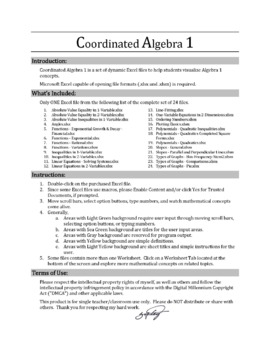
Demonstrate One-Variable Equations in 2-Dimensions with an Animated Excel File
Simple to use animated Excel file for in class demonstration of One-Variable Equations in 2-Dimensions. Graph types include vertical (x=c), horizontal (y=c), and both types on one graph. Move scroll bars, select option buttons, type numbers, and watch these mathematical concepts come alive. You must use Microsoft Excel that is capable of opening file formats in either .xlsx or .xlsm.
Subjects:
Grades:
7th - 12th
Types:

The Slope Guy
This poster is something you can hang up in your classroom showing the slope guy. Digital download, 18 by 24 in Png download.
Subjects:
Grades:
7th - 12th, Higher Education
Types:
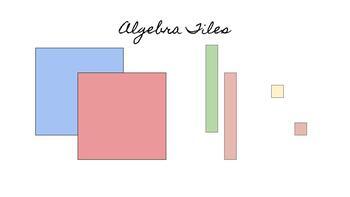
DIGITAL Drag and Drop Algebra Tiles for Distance Learning
Algebra tiles are a must-have for any algebra 1 or algebra 2 class. This is a digital set of drag and drop algebra tiles that can be distributed to students so they have their own set to use while participating in online learning or while socially distancing in 1:1 classrooms.
Subjects:
Grades:
7th - 12th
Types:
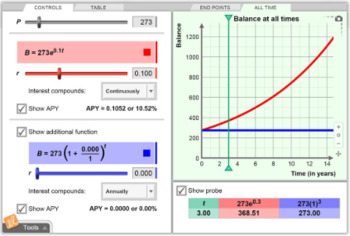
Compound Interest Gizmo
Compound Interest GizmoExplore compound interest in-depth, from compounded annually to compounded continuously. In addition, compare the END POINTS graph, with dots that fit an exponential curve, to the ALL TIME graph, which has a more step-like appearance.
Subjects:
Grades:
7th - 10th
Showing 1-10 of 10 results


