39 results
Free Common Core HSS-ID.B.6 resources
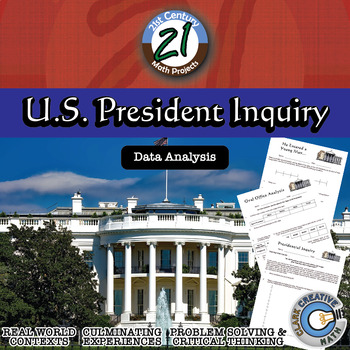
U.S. President -- Data Analysis & Statistics Inquiry - 21st Century Math Project
Engage students in data analysis through use of Presidential data in this 21st Century Math Project. Students will create box and whisker, stem and leaf, histograms and scatterplot through their investigations. In the end, students will take on the inquiry question: "Do US Presidents with the most children live longer after they have been inaugurated?" ***THIS PRODUCT HAS BEEN UPDATED WITH A GOOGLE SLIDES INTERACTIVE VERSION INCLUDED. REDOWNLOAD IF YOU HAVE IT ALREADY***-- In "He Entered a Youn
Subjects:
Grades:
6th - 12th
Types:
Statistics:Scatter Plots and Lines of Best Fit MYSTERY ACTIVITY
In this fun activity students will solve the mystery of the stolen art by collecting data on classmate's standing long jump and height. Students will create a scatter plot and line of best fit for their data; then use their data to make predictions for the 5 suspects. Students will create a one page investigate report to discuss their procedure of investigation, their conclusion, and the strength of their conclusion by interpreting the correlation coefficient. Skills Used:Measure using RulersCon
Subjects:
Grades:
8th - 11th
Types:
CCSS:
Also included in: Common Core Algebra 1: STATISTICS UNIT - BUNDLE PRICE!
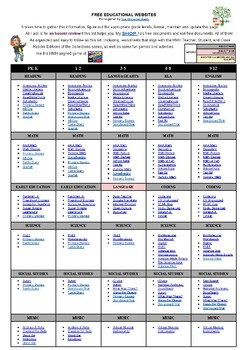
FREE EDUCATIONAL WEBSITES LIST 4 ALL GRADES K-12 AND SUBJECTS + TEACHER RESOURCE
Sometimes, you just need a list of websites for everyone. Here it is. FREE EDUCATIONAL WEBSITES Put together by Teach Me, Maria!It takes time to gather this information, figure out the appropriate grade levels, and format, maintain, and update this page. All I ask is for an honest review if this list helps you.
Subjects:
Grades:
PreK - 12th, Staff
Types:
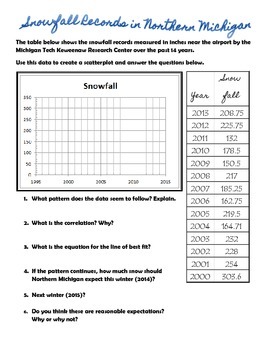
Scatter Plot Prediction Worksheet
This is a worksheet that uses snowfall data from Northern Michigan over the last 14 years. The students will create a scatter plot, determine the correlation, get a line of best fit, and predict two future values.
Subjects:
Grades:
9th - 12th
Types:
CCSS:
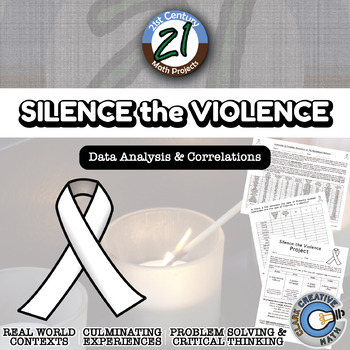
Silence the Violence -- International Data Analysis - 21st Century Math Project
Silence the Violence intends to take a closer look at gun violence throughout the world. Is there a correlation between gun ownership and gun violence? While this is on the news, and people argue back and forth, unfortunately there are not a lot of statistics cited.I built this project through the use of correlations of authentic international data. I have included content for either middle school (plotting and calculating) or high school (calculating correlation with summations). The results ar
Subjects:
Grades:
6th - 12th
Types:
CCSS:
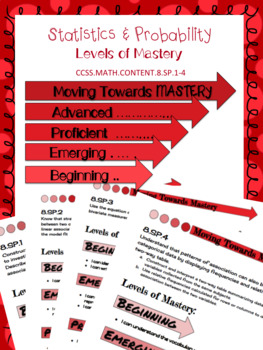
8.SP Scatter Plot & Two-Way Table Levels of Mastery
This product was created to use as an introduction to teaching the eighth grade statistics and probability standards. It allows students to evaluate themselves throughout the process of teaching the standards. It can be printed and provided to each student or printed as posters to be hung in the classroom for easy reference.
Levels of mastery are:
→ Beginning
→ Emerging
→ Proficient
→ Advanced
Levels of Mastery Posters:
★ 8.SP.1 Constructing & Interpreting Scatter Plots
★ 8.SP.2 Line of
Subjects:
Grades:
8th, Higher Education
Types:
CCSS:
Also included in: 8th Grade Math Common Core Growing Bundle

Linear Regression Review Activity With Candy
Students love this linear regression equation activity for finding line of best fit! Looking for a great way to summarize and review linear regression equations? This is a great quick activity for students to practice finding linear regression equations and analyzing its components (plus they get to eat candy!) Check out my other linear resources here!Thanks for checking out my store, Mathy Mrs. J! Please leave feedback to help me continue to improve my products for you.
Subjects:
Grades:
9th - 11th
Types:
CCSS:

Scatter Plots and Trend Lines
Keep students engaged by using kinesthetic activities to create scatter plots. Students will also find linear regression and create analytical questions about their scatter plots. Notes on vocabulary are included.
Grades:
9th - 10th
Types:
CCSS:
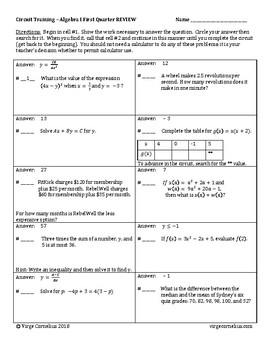
Circuit Training - Algebra I Mixed REVIEW (first quarter)
I wrote this set of 40 mixed review exercises for our algebra one students as they prepare for their first benchmark exam. We have covered about a quarter to a third of the material at this point in the academic year. There is no answer key included since the answers are embedded in the circuit; it is how students move from one equation to the next. The teacher should quickly work the circuit to see how to best use it in his or her classroom. Independent practice? Guided notes? A scavenger hun
Grades:
8th - 10th
Types:
CCSS:
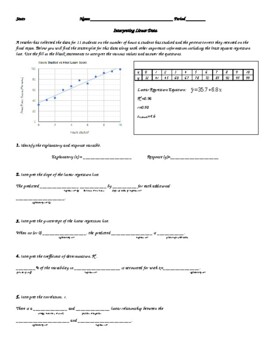
Statistics: Interpreting Linear Data Worksheet
Students will use the information given in the scenario of Hours Studied vs Final Exam Score to interpret statistical measures like correlation, coefficient of determination, the standard deviation of residuals, residuals, and slope and y-intercept of the least-squares regression line. They will use the fill-in-the-blank models to help them interpret these measures. Editable worksheet.
Subjects:
Grades:
9th - 12th
Types:
CCSS:
10 Free Big Brain Math Problems
This is a sample of the 100 and 180 Big Brain Math Problem I have created with a couple of my students. I write these problems on the window of my classroom everyday and get about 5-10 students a day coming to try to solve them. It's been an enjoyable experience to have students come try the problem of the day and share their solutions with me. Please consider purchasing the 100 or 180 Big Brain Math Problems. There's enough for one a day for the entire school year and range from 1-5 Star diffic
Subjects:
Grades:
9th - 12th
Types:
CCSS:
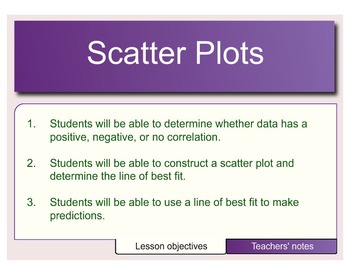
Scatter Plots
This lesson explores creating and analyzing scatter plots by determining the correlation: positive, negative, or no correlation. It also incorporates making predictions based on the line of best fit.
Negative Correlation, Data Display, Scatter Plot, Positive Correlation, Line of Best Fit, Best Fit Line, Correlation, No Correlation, Independent Variable, Dependent Variable
Subjects:
Grades:
7th - 9th
Types:
CCSS:
![Preview of Algebra Project - Ball Bounce Activity [FOLLOWER FREEBIE]](https://ecdn.teacherspayteachers.com/thumbitem/Algebra-Project-Ball-Bounce-Activity-FOLLOWER-FREEBIE--5582074-1589490299/original-5582074-1.jpg)
Algebra Project - Ball Bounce Activity [FOLLOWER FREEBIE]
This is a great project to help students better understand the relationship between geometric sequences and exponential functions with a real-world context. Students will also become familiar with technology in order to create a regression model of the data. Students will analyze their data and present it in a project. A video of the data collection experiment is provided in the video preview. Project exemplars are provided in the product file.
Subjects:
Grades:
8th - 12th
Types:
CCSS:
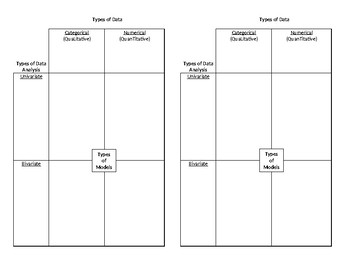
Intro to Data Analysis Graphic Organizer
I created this template for an introduction to my data analysis unit in Algebra I. We discuss and define categorical vs. numerical data, univariate vs. bivariate analysis, and the different graphs or models that apply to each. Since we use Interactive Notebooks, it is designed to be half a page.
Subjects:
Grades:
7th - 12th
CCSS:
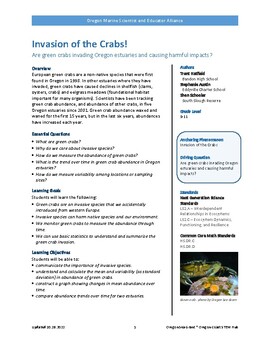
Invasion of the Crabs! Lesson Plan and Activities
Are green crabs invading Oregon estuaries and causing harmful impacts?This lesson plan from Oregon Sea Grant includes:Introduction lesson with video resources"Introduction to Invasive Green Crabs in Oregon" activity with narrated presentation and slides, and handouts"Species on the Move" activity with article and worksheet"Green Crab Abundance" activity with student dataset handout and worksheet, and teacher guidance and answer key"Data analysis" activity for student presentations of dataField t
Subjects:
Grades:
9th - 11th
Types:
CCSS:
NGSS:
HS-LS2-7
, HS-LS2-2
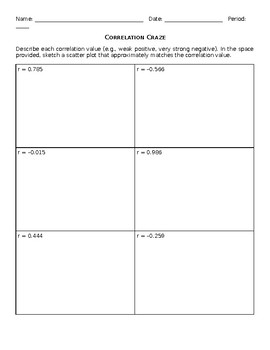
Worksheet: Correlation Craze
This worksheet asks students to determine the strength (strong, moderate, weak) and direction (positive, negative) of correlation coefficients and sketch corresponding scatter plots. Additionally, students differentiate between correlation and causation by discussing the relationship between two variables of their choice.
Subjects:
Grades:
9th - 12th
Types:
CCSS:
Statistics & Probability: Scatter Plots
Students will learn that straight lines are widely used to model relationships between two quantitative variables. For scatter plots that suggest a linear association, informally fit a straight line, and informally assess the model fit by judging the closeness of the data points to the line.Provide feedback and get TPT credit on future purchases:***Go to your My Purchases page. Click on the Provide Feedback button beside each purchase. You will be taken to a page where you can give a quick ratin
Subjects:
Grades:
7th - 9th
CCSS:

Statistics Scatter Diagram and Linear Regression Escape Room
This escape room is meant to be used with physical breakout boxes. It covers scatter diagrams and linear regression. This is for basic or elementary statistics, not AP statistics. Activity varies on time depending on skill level. I use it for my junior and senior students.Material covered: Linear regression, correlation coefficient, coefficient of determination, interpolation, extrapolation, and residuals.
Subjects:
Grades:
11th - 12th
Types:
CCSS:
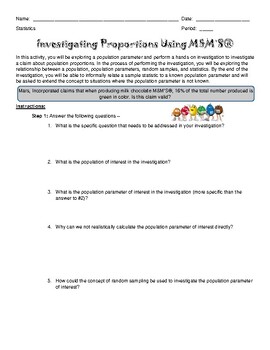
Investigation Proportions - M&Ms
In this activity, students explore a population parameter and investigate a claim about population proportions.
Subjects:
Grades:
6th - 10th
Types:
CCSS:

Animal Collective: Interdisciplinary Science Mini-Unit
This FREE, interdisciplinary mini-unit is all about how group behavior can produce surprising problems...and solutions! The Gist: Students will draw their own social networks, ponder the meaning of complexity and begin to notice unexpected patterns that emerge around them, unnoticed. Through hands-on activities and digital experiments, students will discover how complexity research enriches our daily lives.Driving Questions: Why do humans and other animals live in groups?How do simple behavioral
Subjects:
Grades:
11th - 12th, Higher Education
CCSS:
NGSS:
HS-LS4-2
, HS-LS4-3
, HS-LS2-8
Algebra 1 Curriculum Outline
This product is associated with the content that goes with the Algebra 1 Curriculum. This also includes the Common Core Standards that go with each section in each unit. Unit notes, worksheets, reviews, and tests will be posted in the next few weeks. I will also link them here.
Subjects:
Grades:
9th - 10th
CCSS:
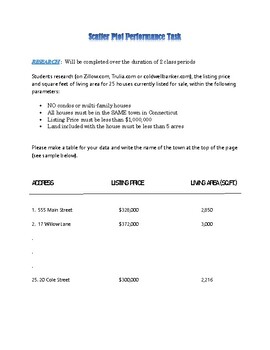
Scatter Plot Performance Task - Houses for Sale
Students will research houses that are for sale and will compare listing price and square footage of living space. They will create a scatter plot, write the equation of the line of best fit, use their equation to extrapolate square footage for a $1 million house, and identify any relationship between the data.
Grades:
8th - 9th
Types:
CCSS:
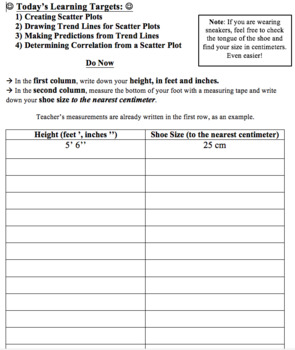
Scatter Plots and Trend Lines
Students will gather data to create a scatter plot. They will learn how to create trend lines for scatter plots and determine the correlation that exists between two sets of data.
Subjects:
Grades:
7th - 10th
Types:
CCSS:
Passion-Driven Statistics E-book (Introductory/AP Statistics Course Textbook)
Passion-Driven Statistics is an NSF-funded, multidisciplinary, project-based curriculum that supports students in conducting data-driven research, asking original questions, and communicating methods and results using the language of statistics. The curriculum supports students to work with existing data covering psychology, health, earth science, government, business, education, biology, ecology and more. From existing data, students are able to pose questions of personal interest and then use
Subjects:
Grades:
6th - 12th, Higher Education, Adult Education
Types:
Showing 1-24 of 39 results

