270 results
Common Core HSS-ID.B.6 resources under $5
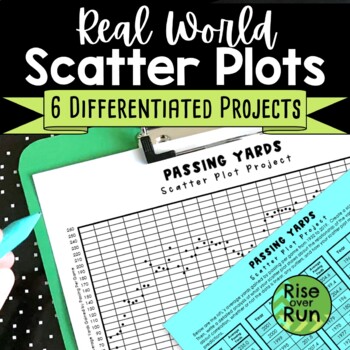
Scatter Plot Project with Real World Sports Data
Practice creating and analyzing scatter plots with these six differentiated real world projects. Students are provided statistics for a sport and must graph the data. Then, they write an analysis describing correlation, whether or not the data is linear, any outliers, and how the scatter plot might be used to make predictions. The scatterplots range from 38 points to 149 points, so they can be used to differentiate. The scatter plots will take a little time to plot, but they result in real
Subjects:
Grades:
8th - 9th
Types:
CCSS:
Also included in: 8th Grade Math Activities & Lessons Bundle for the Whole Year
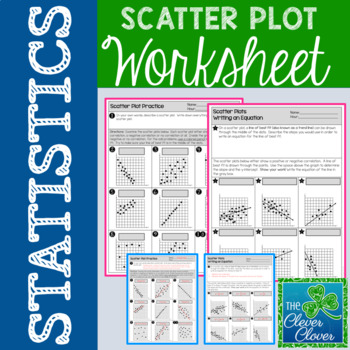
Scatter Plot Worksheet
Scatter Plot Worksheet
This resource allows students to explore scatterplots with a two page worksheet. Students are asked to define scatterplots in their own words. Nine questions ask students to identify the type of correlation (positive, negative or no correlation) that exists between two variables. Students are also asked to describe the steps used to write an equation for the line of best fit. Six additional questions require students to calculate the slope and determine the y-intercept
Subjects:
Grades:
6th - 9th, Adult Education
Types:
CCSS:
Also included in: Scatter Plot Mini-Bundle
Scatter Plots Statistics Worksheet 8.SP.A.1
Hello, Amazing Educators! Ready to transform scatter plots from a math challenge to a thrilling adventure? Our Interactive Scatter Plot Worksheet is here to make learning a breeze and turn your classroom into a hub of critical thinking and problem-solving excitement! Why Choose Our Interactive Worksheet? Engaging and Interactive: Say goodbye to dull lessons! This two-sided worksheet is packed with interactive elements that keep students hooked. From constructing and interpreting scatter plots to
Subjects:
Grades:
8th
Types:
CCSS:
Also included in: Scatterplots Two Way Tables and Residual Plots Worksheets Bundle
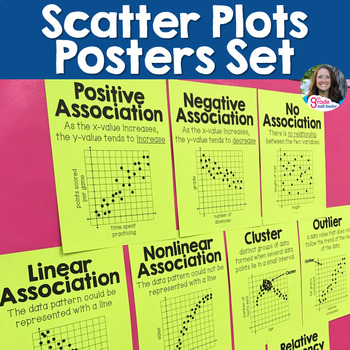
Scatter Plots and Two Way Tables Posters Set for 8th Grade Math Word Wall
Make the vocabulary visible and accessible for your students! This set of 12 printable vocabulary posters provides visuals and reminders for your students to reference during your Bivariate Data unit. Display these on your word wall while teaching scatter plots and two-way tables!The following vocabulary terms are included:scatter plotpositive association or positive correlationnegative association or negative correlationno association or no correlationlinear associationnonlinear associationoutl
Subjects:
Grades:
8th - 9th
Types:
CCSS:
Also included in: 8th Grade Math Vocabulary Posters for Word Wall - Full Year
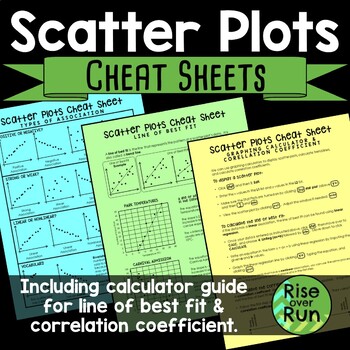
Scatter Plot Cheat Sheets Printable Guided Notes
Detailed sheets for the following topics: •Types of Association & VocabularyThis page shows examples of positive, negative, strong, weak, linear, and nonlinear association. It also shows clusters and outliers.•Line of Best FitThis page explains what a line of best is (or trend line) along with examples and nonexamples. It has 2 real world connections and how to interpret the line of best fit.•Graphing Calculator Guide & Correlation CoefficientThis sheet gives step by step instructions fo
Subjects:
Grades:
8th - 9th
CCSS:
Also included in: 8th Grade Math Activities & Lessons Bundle for the Whole Year
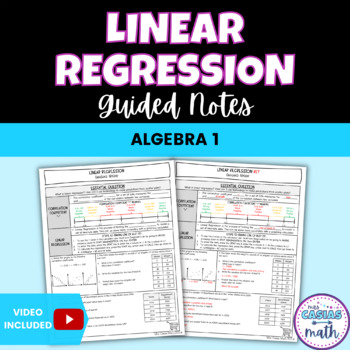
Linear Regression and Correlation Coefficient Guided Notes Lesson Algebra 1
This concise, to the point and no-prep linear regression lesson is a great way to teach & introduce how find the correlation coefficient and line of best fit with technology to your students. These notes go over the steps to using linear regression on a TI-84 calculator and include 3 in-depth examples with multiple parts where students find & interpret the correlation coefficient & line of best fit. Students and teachers love how easy these notes are to follow and understand. These n
Subjects:
Grades:
8th - 9th
CCSS:
Also included in: Linear Equations and Inequalities Algebra 1 Guided Notes Lessons BUNDLE
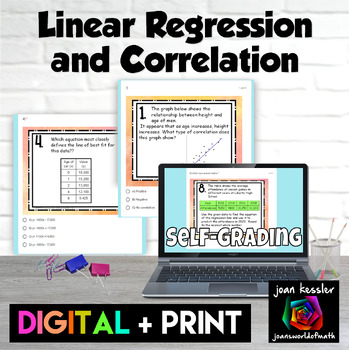
Linear Regression and Correlation Digital plus Print with TI-84 notes
This Linear Regression and Correlation activity is a great way for your students to practice their skills. There are 12 well chosen representative problems. Digital and printable PDF versions included. Questions include:CorrelationLine of Best FitProjecting TrendsFind the linear regression from a tableFind the linear regression from a scatter plotDetermining the correlation coefficientThe editable digital self checking version can be used as an Quiz, HW, or Paperless worksheet and is designed
Subjects:
Grades:
8th - 10th
Types:
CCSS:
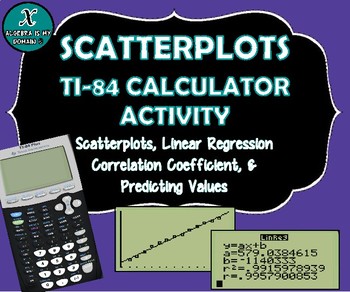
TI-84 CALCULATOR ACTIVITY - Data, Scatterplots, Regression & Line of Best Fit
This file includes four linear regression examples (all real-life data). The examples cover the following topics for the TI-84 graphing calculator:
* Creating a scatterplot
* Performing linear regression (finding the equation of the best-fit line)
* Interpreting the slope of the equation
* Calculating and interpreting the correlation coefficient
* Predicting values (using the linear regression equation)
The first example gives the step-by-step instructions to calculate all the necessary value
Subjects:
Grades:
7th - 12th, Higher Education
Types:
CCSS:
High School Data Analysis Project
This project covers a large range of data analysis methods. There are eleven total parts to the project.
Part One: the students have to collect data from 20 students outside of the classroom. Directions specify to ask students from each grade level.
Part Two: Measures of Center and Variation. Students will calculate mean, median, mode, range, and standard deviation for some of the data collected. Definitions of each term are included.
Part Three: Box-And-Whisker Plot. Students will create t
Subjects:
Grades:
9th - 12th
Types:
CCSS:
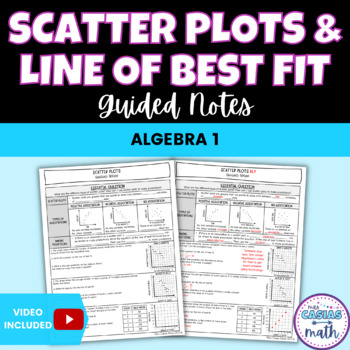
Scatter Plots and Line of Best Fit Guided Notes Lesson Algebra 1
This concise, to the point and no-prep scatter plots lesson is a great way to teach & introduce how to write the line of best fit to your students. These notes go over types of associations from scatter plots, and how to make predictions from scatter plots by writing the equation for the line of best fit without technology. There are 3 in-depth examples with multiple parts where students practice writing the line of best fit with two points from the line and use it to predict. Students and t
Subjects:
Grades:
8th - 9th
Also included in: Linear Equations and Inequalities Algebra 1 Guided Notes Lessons BUNDLE
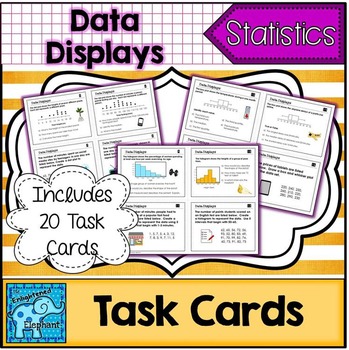
Data Display Task Cards
There are 20 total task cards, a student recording sheet and answer key. These tasks meet HSS.ID.A.1, HSS.ID.A.3, HSS.ID.B.6
There are 4 questions for each of the following types of data displays:
dot plots
stem and leaf plots
histograms
box plots
scatter plots
Students will be asked to read and interpret each type of data display as well as create each type of data display from a contextual set of data.
Use task cards at centers or stations, for entrance and exit tasks and for activities lik
Subjects:
Grades:
7th - 10th
Types:
CCSS:
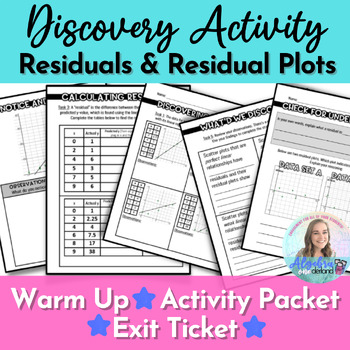
Residuals and Residual Plots Discovery Lesson Activity for Algebra 1
Make understanding residuals and residual plots east with this hands-on, discovery activity packet. Students will understand how residuals, regression and line of best fit connect and what the residuals tell us about the fit of the line. Included:A "Notice and Wonder" Task to start the lessonAn activity packet with three observation tasks related to line of best fit / linear regression, scatter plots, residuals and residual plots; culminating in a task that generalizes the concept of residuals a
Subjects:
Grades:
8th - 12th
Types:
CCSS:
Also included in: Algebra 1 Digital Activities for Google Slides Bundle #1!
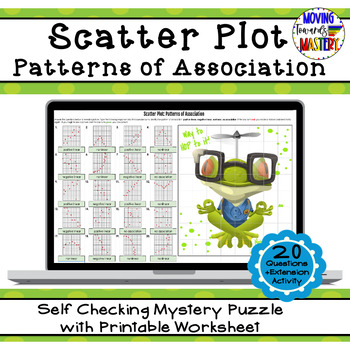
Scatter Plot: Patterns of Association Self Checking Mystery Picture
Engaging math self checking review activity to practice identifying patterns of association for scatter plots.This self-checking activity will allow students to practice identifying patterns of association for scatter plots. Students will use their understanding of scatter plots to answer questions to reveal pieces of a mystery puzzle as they work, just like a pixel art activity! If students answer incorrectly, the box will turn red and NO picture pieces will be revealed. This resource include
Subjects:
Grades:
7th - 10th
Types:
CCSS:
Also included in: 8th Grade Math Common Core Growing Bundle
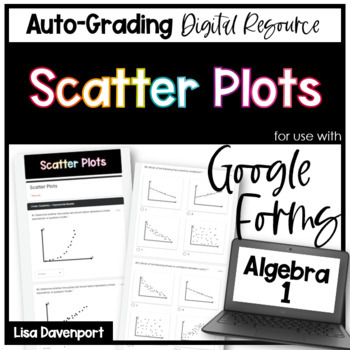
Scatter Plots Google Forms Homework
This 24-question, auto-grading Google Forms assignment provides students with practice analyzing & interpreting scatter plots. The following types of questions are included:Types of Correlation (positive/ negative/ no/ weak/ strong)Identifying Linear, Exponential, or QuadraticWriting a Line of Best FitInterpreting a Scatter Plot on Real- World DataQuestions are "drop-down", "multiple choice", and "select all that apply".This download also includes a PDF "worksheet" with the exact same quest
Subjects:
Grades:
7th - 10th
Types:
CCSS:
Also included in: Algebra 1 Google Forms Semester 2 Digital and Printable Homework Bundle
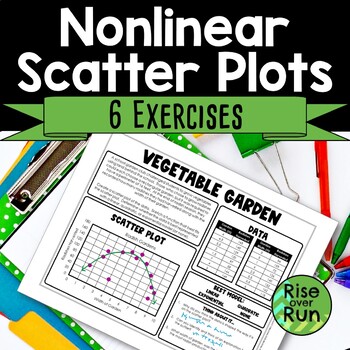
Nonlinear Scatter Plot Practice Activities
Explore non-linear scatter plots with these activity sheets! Included are 6 different sheets that each include a description of data collection, a table of data, a graph, and questions to encourage thinking. Students use the given data to create a scatter plot, determine if the relationship is linear, quadratic, exponential, or none of those. Then they sketch a line of best fit and answer questions. A blank template is included as well so students can create their own scatter plots. These works
Subjects:
Grades:
9th - 12th
Types:
CCSS:
Also included in: Algebra 1 and 8th Grade Math Curriculum Bundle for Entire Year
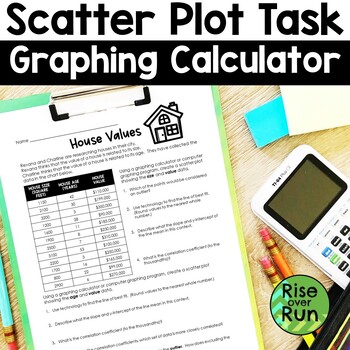
Scatter Plot Worksheet with Graphing Calculator Practice
Need a real world scatter plot activity where students use their graphing calculators? Grab this activity and help your students understand lines of best fit and calculating correlation coefficients!Students are given data on house sizes, house ages, and house values. They use a graphing calculator or computer program to plot the points and answer questions that follow.This is a great activity for partners to explore or for individual work. It can lead to some great math discussions!Answer key
Subjects:
Grades:
8th - 9th
Types:
CCSS:
Also included in: Algebra 1 and 8th Grade Math Curriculum Bundle for Entire Year

42 Blank Graph Templates: Horizontal & Vertical Bar Graph, Line Graph, Printable
Looking for an array of printable graph templates for all your future bar and line graph needs? Look no further! With 42 different templates ranging for bar graphs, to line graphs, varying in X values and Y values, this combination should be the last graph download you need to worry about for your class. These graphs can even be used as Histograms, Dot Plots, Scatter Plots, or a variety of other graphs to suit the needs of your classroom.I created this template to require all the basics of gr
Grades:
4th - 12th
Types:
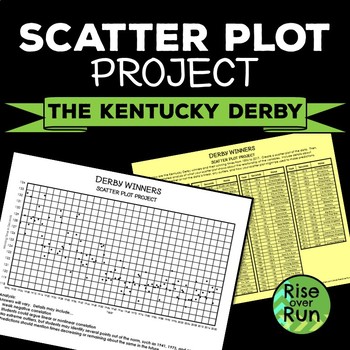
Scatterplot Project with Real World Stats from the Kentucky Derby
Practice creating and analyzing scatter plots with this project. Students are provided statistics for winning horses and must graph the data. Then, they write an analysis describing correlation, whether or not the data is linear, any outliers, and how the scatter plot might be used to make predictions. This is one of the projects in my Differentiated Scatter Plot Projects!Thank you for your interest in this resource from Rise over Run. Related Resources:Scatter Plot Practice WorksheetsScatter
Grades:
8th - 9th
Types:
CCSS:
Also included in: Algebra I Sub Plans Bundle with Activities
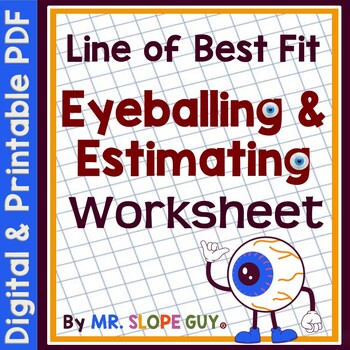
Line of Best Fit Practice Worksheet
Hello Math Teachers! Are you looking for a fun and engaging way for your students to practice their scatterplot skills? Check out this worksheet that focuses on eyeballing the line of best fit and estimating the correct equation that corresponds with it.With this two-sided worksheet, students will have the opportunity to practice using scatterplots and make the connection to the fit of a linear function. The scaffolding includes matching equations to the line of best fit (regression line), which
Subjects:
Grades:
8th
Types:
CCSS:
Also included in: Scatterplots Two Way Tables and Residual Plots Worksheets Bundle

Statistics Survey Project - Project Based Learning (PBL) with Math
Watch your students dive into the world of math as they create, execute, and analyze their own survey! Students will demonstrate mastery of data gathering, survey sampling, developing appropriate survey questions, data tables, Direct Variation, discrete graphs, dot plots, box and whisker graphs, and calculating the inter-quartile range.The Unique Survey Project is highly engaging, capitalizing on the innate curiosity of the adolescent mind. You will love the low-prep instructional guide. Your st
Subjects:
Grades:
6th - 10th
Types:
Also included in: Fun with Ratios Activities Bundle - 7th Grade PBL with Math
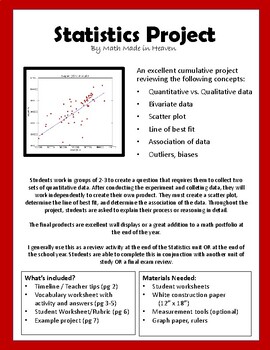
Statistics Project: scatter plot, line of best fit, association of data
An excellent cumulative project reviewing the following concepts: •Quantitative vs. Qualitative data•Bivariate data•Scatter plot•Line of best fit•Association of data (strong, weak, linear, non-linear, positive, and negative)•Outliers, biases, population, sample groupStudents work in small groups to create a question that requires them to collect two sets of quantitative data. After planning and conducting the experiment and collecting data, they will work independently to create their own produc
Subjects:
Grades:
7th - 10th
Types:
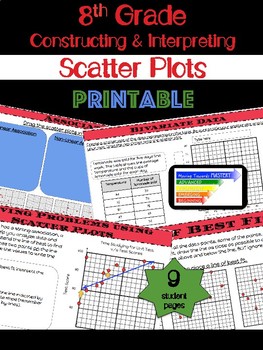
8th Grade Math Constructing & Interpreting Scatter Plots
Extensive printable lessons for constructing and interpreting scatter plots.The lessons are scaffolded to build understanding. Students will progress from identification of terms to making predictions involving bivariate data. The guided lessons will begin with identification, move towards assisted analysis, and conclude with independent practice.Lessons include...♦ Definitions and Visual Representations♦ Identification and Use of Terms → Bivariate Data → Scatter Plot → Linear, Nonli
Subjects:
Grades:
8th - 10th
Types:
CCSS:
Also included in: 8th Grade Math Common Core Growing Bundle
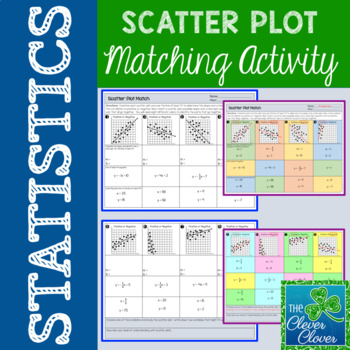
Scatter Plot Matching Activity
Scatter Plot Matching Activity
This resource allows students practice with scatter plots. Students will examine eight scatter plots. With each scatter plot, they will do the following:
✓ Identify if the scatter plot shows a positive or negative correlation
✓ Calculate the slope and determine the y-intercept
✓ Write the line of best fit equation
✓ Match a scatter plot, slope & intercept, line of best fit equation and possible coordinate pair
Students are asked to think of two variables t
Subjects:
Grades:
6th - 9th, Adult Education
Types:
CCSS:
Also included in: Scatter Plot Mini-Bundle
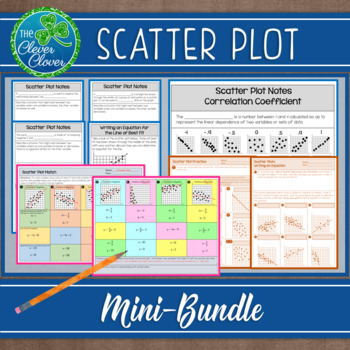
Scatter Plot Mini-Bundle
This resource includes six half pages of notes that are perfect for interactive notebooks. The first three pages introduce students to positive, negative and no correlation scatter plots. Students are asked to describe real world situations that might exist for each type of correlation. Students will graph three different sets of data in order to visualize the different types of scatterplots. Definitions for the line of best fit and correlation coefficient are provided. Each one of the half p
Subjects:
Grades:
6th - 9th, Adult Education
CCSS:
Showing 1-24 of 270 results

