27 results
Statistics graphic organizers for Google Apps
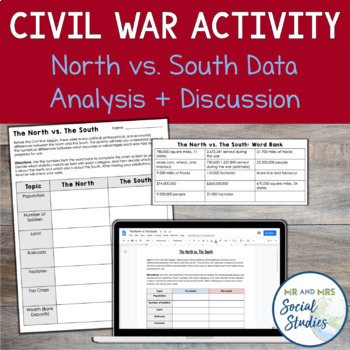
Civil War Activity | North vs South Statistics Activity and Worksheet
This no-prep American Civil War activity will help your students understand the differences between the North and the South...using data! If you need an activity to kick-off your Civil War unit or want a resource that highlights the differences between the North and the South, this is the resource for you! In this engaging activity, students receive a blank chart with many categories of data about the Civil War. Some of these categories include the population, the number of factories, and total
Grades:
7th - 10th
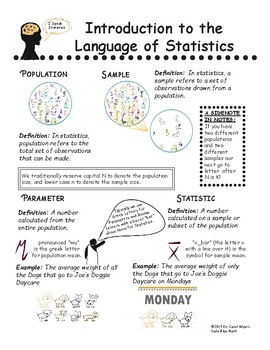
Introduction to the Language of Statistics - SketchNotes and Lecture Slides
This is a guided lecture that covers the basic vocabulary of Statistics, including Population, Statistic, Types of Data, Types of Sampling and Types of Studies. The lecture notes use simple pictures, icons and examples to help students visualize the language. The lesson includes: Teacher Notes4-pages of SketchNotes completely filled in4-pages of SketchNotes with blanks for students to fill inA 10 question (1 page) Knowledge Check for formative assessmentThe answer key for the Knowledge CheckA
Subjects:
Grades:
10th - 12th, Higher Education
CCSS:
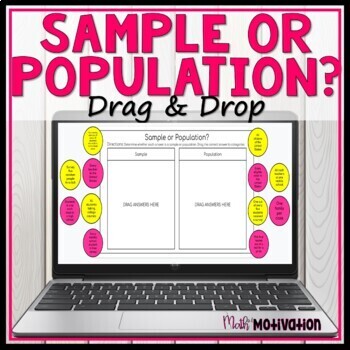
Sample or Population Digital Drag and Drop
This digital drag and drop is perfect for determining groups that are samples or populations, making this the perfect activity for the introduction to probability unit for 7th grade. Students will practice sorting samples and populations by matching up each of the questions and the answers using the moveable answer pieces on google slides. Students will sort 12 groups. Answer Key included!Check out these other 7th Grade Sorting Resources:Proportions Sorting Drag & DropSolving Proportions Dra
Subjects:
Grades:
7th - 8th
CCSS:
Also included in: 7th Grade Math Activities Bundle Part One
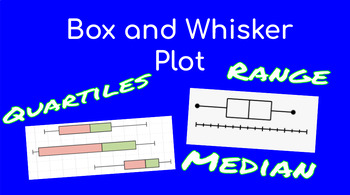
Box and Whisker Plots -- Video Notes, Graphic Organizer, and Differentiated WS
This set of video notes focuses on how to read and interpret a box and whisker and key features of the box plots. Topics include median, range, quartiles, interquartile range. Students learn how to use a box and whisker plot to compare data sets. Video includes definitions, explanations, and examples including released end of course test questions.Included:-Link to Downloadable/sharable .mp4 video, Box and Whisker Plots (10:53)-Matching Graphic Organizer for Student Use-Differentiated Practic
Subjects:
Grades:
8th - 9th
CCSS:
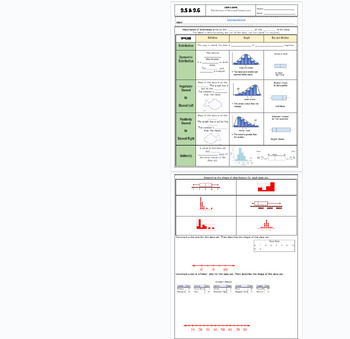
Data Distribution positive/negative skewed fillable notes UPDATED
Unit 9: Data and Stats: Updated(No 9.3/ Skip)9.5/9.6 Data Distribution (skewness)Students go over the vocabulary and complete the examples with the vocabulary scaffolded. Skewness is explained and how to identify it comparing data charts and box and whisker plots. Uses many visuals and examples to differentiate between that different graphs. Notes are scaffolded. Includes hook video hyperlinked on the "learning objective" title. Key is included and hyperlinked as a PDF in the heading highlighted
Subjects:
Grades:
6th - 12th, Higher Education, Adult Education
CCSS:
Also included in: Unit 9: Data and Statistics Fillable Notes

Bracket Builder for Tournaments
Looking to bring some friendly competition in your curriculum? Use these editable brackets to bring a tournament into your classroom! These editable brackets will self-populate based on the order you rank your teams. This is a great opportunity to teach about statistics and probability in real-life situations. In this spreadsheet, you will get:Linked spreadsheets so your data can be filled in on one spreadsheet and auto-populate on the bracket of choice.2 different 16 team brackets – one standar
Grades:
Not Grade Specific
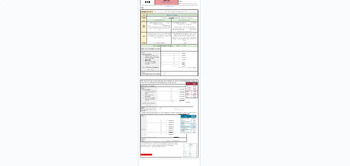
Standard Deviation Fillable Notes UPDATED
Unit 9: Data and Stats: Updated(No 9.3/ Skip)9.4 B Standard DeviationStudents go over the vocabulary and complete the examples with the vocabulary scaffolded. Standard deviation is long hand calculated by showing each step of the process (difference of squares). Real-world examples are explained in notes before calculating to show the importance of this stat and why it is used so often to verify valuable and effective data. Notes are scaffolded. Includes hook video hyperlinked on the "learning o
Subjects:
Grades:
7th - 12th, Higher Education, Adult Education
CCSS:
Also included in: Unit 9: Data and Statistics Fillable Notes
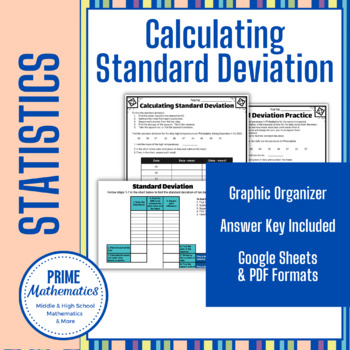
Calculating Standard Deviation Graphic Organizer
Use this graphic organizer to teach students the process of finding the standard deviation of a data set. In addition to the pdf, a self-checking Google Sheet is also included. The data sets from the pdf can be used in the Google Sheet or you can use any data set of ten items (and it still checks each step of the process). This product includes:a Graphic Organizer worksheet pdf with two sets of data and a blank versionan answer key for the Graphic Organizer worksheet pdfa self-checking Google Sh
Subjects:
Grades:
6th - 12th
CCSS:
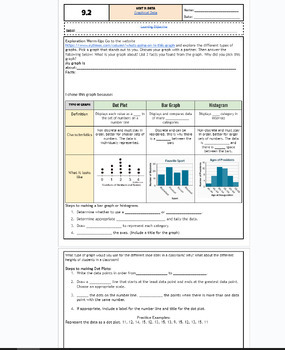
Graphical Data: Bar Charts, Dot Plots and Histograms fillable notes UPDTD
Unit 9: Data and Stats: UpdatedUpdated9.2 Graphs: bar, dot plot, histpgramStudents go over the vocabulary and define each type fo graph and what data fits for each graph. The warm up is an exploratory activity where students go on a website to search for their graph of interest and discuss the key findings. This takes around 10-15 mins and students enjoyed it! Notes are scaffolded. Includes hook video hyperlinked on the "learning objective" title. Key is included and hyperlinked as a PDF in the
Subjects:
Grades:
6th - 12th, Higher Education, Adult Education
CCSS:
Also included in: Unit 9: Data and Statistics Fillable Notes
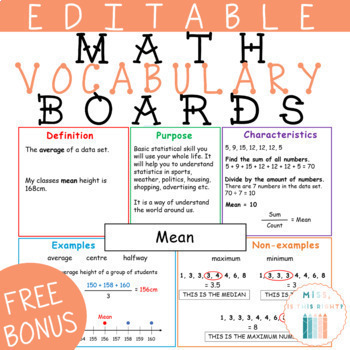
What is Mean Median Mode and Range? - Frayer Model
What is mean, median, mode and range? These Math Vocabulary Boards will give you the answer through definitions of mean, median, mode, range, as well as help students to understand the purpose, characteristics, examples and non-examples. Mean, median, mode and range worksheets are the perfect visual tool for whole-class learning, small groups, individual activities and as a classroom display. They enhance learning for EAL/ESL and SEN students. In this product, you will receive the four words (me
Subjects:
Grades:
6th - 8th
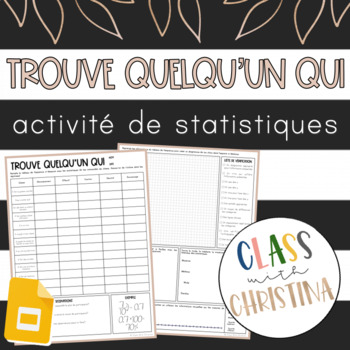
Trouve Quelqu'un Qui - Activité de Statistiques Après Les Vacances
Une version pour les grands d'une activité populaire après les vacances. Les élèves réalisent l'activité « Trouve quelqu'un qui » et analysent leurs résultats.Les questions « Trouve quelqu'un qui » sont suffisamment générales pour pouvoir être utilisées au retour de n'importe quelle pause scolaire ! (Ex : Trouve quelqu'un qui a fait la grasse matinée, mangé un bon repas, fait une activité à l'extérieur...)Concepts clés de cette activité :Tableau de fréquenceConversion de fractions, décimales et
Subjects:
Grades:
6th - 8th
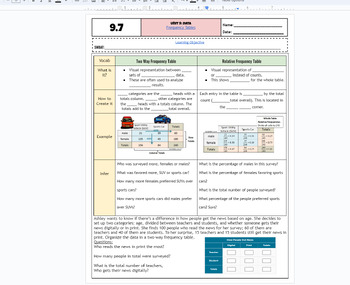
Frequency Tables & Relative Frequency Tables fillable notes UPDATED
Unit 9: Data and Stats: Updated(No 9.3/ Skip)9.7 Frequency Tables Students go over the vocabulary and complete the examples with the vocabulary scaffolded. Students examine a categorical table/frequency table and also use that information to create relative frequency tables. Different real-world examples and problems are used. Emphasized how percents and decimals are calculated. Notes are scaffolded. Includes hook video hyperlinked on the "learning objective" title. Key is included and hyperli
Subjects:
Grades:
6th - 12th, Higher Education, Adult Education
CCSS:
Also included in: Unit 9: Data and Statistics Fillable Notes
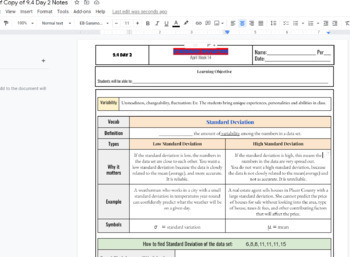
Standard Deviation Scaffolded Fillable Notes AND key
Standard Deviation Scaffolded Fillable Notes AND key, give definitions to the terms with real-world examples! Includes a video link in the notes as the intro to the lesson by describing the meaning and need for standard deviation in the simplest form possible! The key is linked at the top of notes as well that will download as a pdf- not a google doc- did not do the last problem on the bottom as it was an exit ticket for students (no layout).
Subjects:
Grades:
7th - 12th, Higher Education, Adult Education
CCSS:
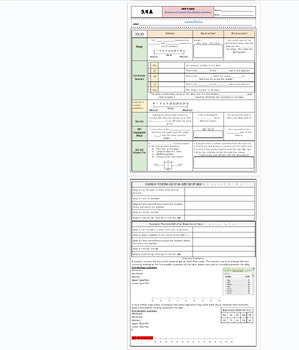
5 Number Summary and Box and Whisker Plots Fillable Notes UPDATED
Unit 9: Data and Stats: Updated(No 9.3/ Skip)9.4 A 5-number summary and box and whisker plot Students go over the vocabulary ad complete the examples with the vocabulary scaffolded. for each statistic with an explanation of the purpose of the 5 number summary and why these are used. Notes are scaffolded. Includes hook video hyperlinked on the "learning objective" title. Key is included and hyperlinked as a PDF in the heading highlighted in the orange box, and at the bottom of the google doc as w
Subjects:
Grades:
6th - 12th, Higher Education, Adult Education
CCSS:
Also included in: Unit 9: Data and Statistics Fillable Notes
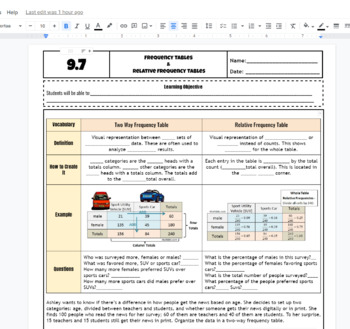
Two way frequency tables and relative frequency table scaffolded fillable notes
Two way frequency tables and relative frequency table scaffolded fillable notes with KEY included for Math 1 HS class. This can be used as a graphic organizer. 100 percent editable to your liking! Introduce the vocabulary with simple problems to finish out the tables and find the percentages of each category. This is an easy introduction lesson students can use for their understanding of frequency tables. You can add in conditional and marginal tables for deeper dive into the concept. Real-worl
Subjects:
Grades:
7th - 12th, Higher Education, Adult Education
CCSS:
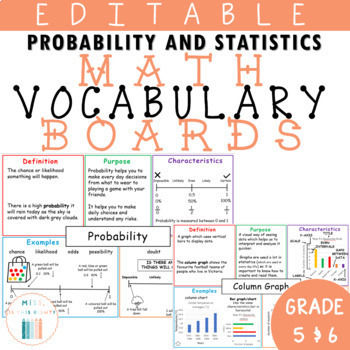
Probability activity - Frayer Model
This probability activity is a new effective method to help your students learn statistics and probability in a visual way. The Math Vocabulary Boards will have your students exploring statistic and probability definitions, purpose, characteristics, examples and non-examples. This activity for probability is designed to help EAL/ESL and SEN students. They are perfect for a classroom display or to be used in whole class lessons, small groups and individual activities. ⭐Be sure to check out my Mat
Subjects:
Grades:
5th - 6th
Also included in: Math Vocabulary Activity - Frayer Model

6th Statistics Doodle Notes & Practice
The Statistics Doodle Notes have notes AND practice for all concepts. Each slide is ready to be cut in half (with notes on one side and guided practice on the other). Covers one "two-page" view in student notebook.Set also includes "title page" printables with 4 cut-outs to help with organization.All slides are print-ready (formatted to 8.5 x11 in landscape with NO waste and no formatting needed)!For a limited time (as a Thank You to introduce my work), colored teacher set is included with a 5-s
Subjects:
Grades:
6th
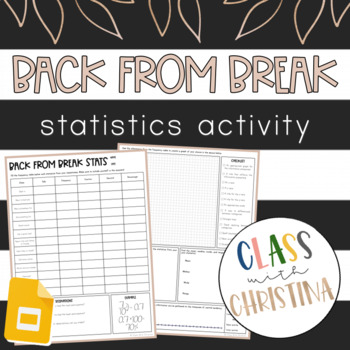
Back From Break - Statistics Analysis and Graphing Activity
A big-kid spin on a popular post-break activity. Students will complete a 'find someone who' activity and analyze their results.Find someone who questions are broad enough that they can be used when coming back from any school break! (Ex: Find someone who slept in, ate a good meal, did an activity outside...)Key concepts in this activity:Frequency tableFractions, decimals, and percentages conversionGraphingStem and leaf plotMeasures of central tendency (mean, median, mode, range)Box and whisker
Subjects:
Grades:
6th - 8th
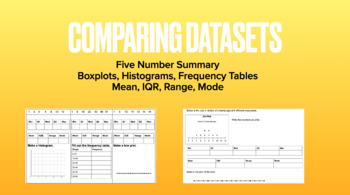
Comparing Datasets (Five Number Summary, Box Plots, Histograms, Variability)
This is a completely editable review worksheet of:-Finding the 5 number summary from a dataset.-Creating a histogram from a dataset.-Creating a box plot from a dataset. -Creating a frequency table from a dataset.-Identifying which dataset has the most variability.-Calculating the mean, IQR, range, and mode from a dataset.
Subjects:
Grades:
7th - 10th
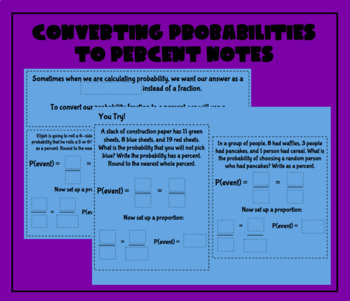
Converting Probabilities to Percents Notes
Digital notes for taking theoretical probabilities and converting them into a percent using proportions. Students should have an understanding of finding theoretical probability as a simplified fraction before completing these notes. Would work great with an instructional video!
Subjects:
Grades:
7th
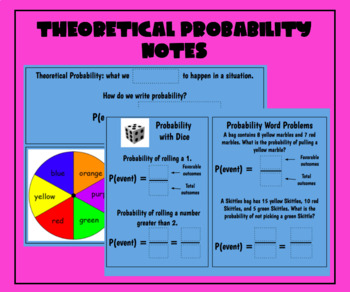
Theoretical Probability Notes
Digital notes for exploring what theoretical probability is and how to find it in different situations including spinning a spinner, rolling a die, and other story problems. Would work great with an instructional video!
Subjects:
Grades:
7th
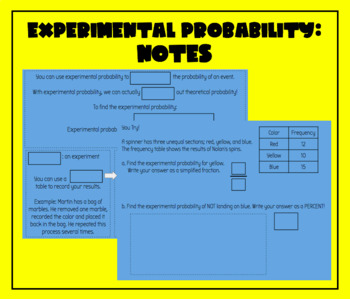
Experimental Probability Notes
Digital notes that explore what experimental probability is and how to find the experimental probability of simple events as a simplified fraction and as a percent. Would work great with an instructional video!
Subjects:
Grades:
7th
Also included in: Experimental Probability Bundle
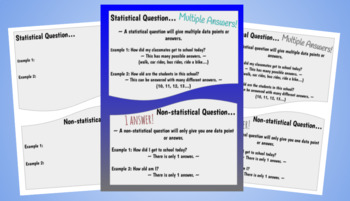
Statistical Questions Graphic Organizer
This graphic organizers demonstrates the difference between a statistical and a non-statistical question. There is a presentable color version as well as a printable version.
Subjects:
Grades:
6th
Types:

Segmented Bar Graph Frame
Two Segmented Bar Graphs on one page for students to use to complete assignments.
Subjects:
Grades:
8th - 12th
CCSS:
Showing 1-24 of 27 results


