215 results
Graphing Common Core 7.RP.A.2 resources
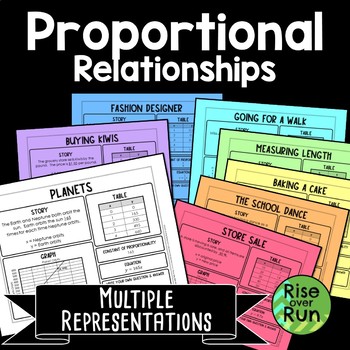
Proportional Relationships Graphing with Multiple Representations
These multiple representation math tasks help students make connections between graphs, tables, equations, and real world scenarios. Students are given a little information and must think how to fill in the rest!8 activity sheets each include: a story a grapha tableconstant of proportionalityan equation a space for students to write their own question and answer. A blank template is included as well so students can create their own proportional relationship.Multiple representations are a great w
Grades:
7th - 8th
Types:
Also included in: 8th Grade Math Activities & Lessons Bundle for the Whole Year
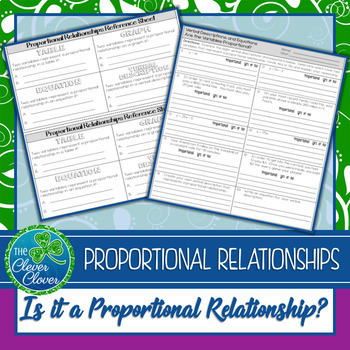
Proportional Relationships - Equations, Tables and Graphs
Use this quality resource to have students be able to identify proportional relationships in equations, tables and graphs! Included, you will have a reference sheet, worksheets, exit slips and an assessment. This no-prep product can help your students identify proportional relationships! You can save 20% by purchasing this resource in one of the following bundles. Check them out!• Proportional Relationships in Tables, Graphs and Equations Mini-Bundle• Ratios and Proportional Reasoning BundlePle
Subjects:
Grades:
6th - 8th
Types:
CCSS:
Also included in: Proportional Relationships in Tables, Graphs and Equations Mini-Bundle
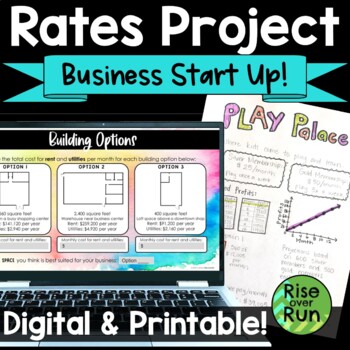
Rates & Proportional Relationships Real World Project
Students work with real world rate of change and proportional relations as entrepreneurs creating a business startup! They will love getting creative, and you will love that everything is ready to go to get them thinking about math. This project is included in printable PDF version, Google Slides, and PowerPoint.In this project, students get creative as they decide on a type of business, membership fees, and a building location. Then they must calculate their costs and profits based on those dec
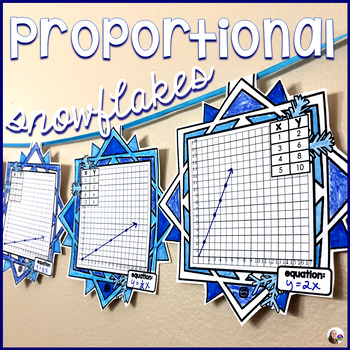
Graphing Proportional Relationships Snowflake Winter Math Pennant Activity
Students plot coordinates of proportional relationships then find their equations in this winter math activity that doubles as classroom décor. The given coordinates in the tables do not always start with (0, 0) and also are not always consecutive. For example, a table may give the coordinates (1, 2), (3, 6), (4, 8), (5, 10), skipping (2, 4). After plotting, students are asked to determine their graph's equation.Included in this snowflake activity are 30 pennants. Also includes 2 extra pennants
Grades:
6th - 8th
Types:
Also included in: All Math Pennants Bundle
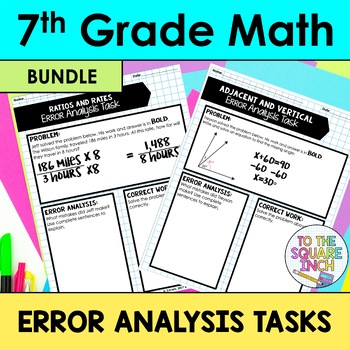
7th Grade Math Error Analysis Task Bundle
7th Grade Math Error Analysis Tasks- One task for each Common Core Standard*60 different error analysis tasks for each 7th Grade Common Core Standard. This is a bundle of 5 different products at over a 20% discount. Please click on each link to see individual product descriptions. The Number System Topics include: Terminating and Repeating DecimalsAdding Integers with Different SignsAdding Integers with the Same SignAdding Rational NumbersMultiplying IntegersDividing IntegersMultiplying Rational
Subjects:
Grades:
6th - 8th
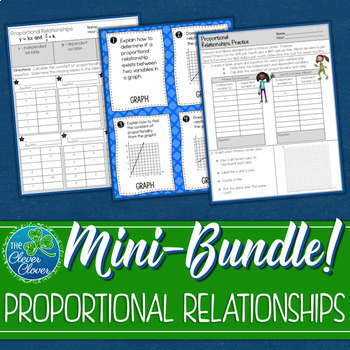
Proportional Relationships in Tables, Graphs and Equations Mini-Bundle
If you are looking for a solid resource to supplement your proportional relationships instruction, this is it! This resource includes task cards, worksheets, and assessments on proportional relationships in tables, graphs and equations. Below you will find a detailed description of each resource. Proportional Relationship Task CardsThis product includes twenty task cards divided into five stations about proportional reasoning. The stations include four questions on each of the following: graph
Grades:
6th - 8th
Types:
CCSS:
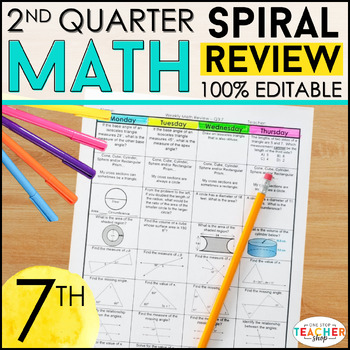
7th Grade Math Spiral Review & Quizzes | Homework or Warm Ups | 2nd QUARTER
This 7th Grade math spiral review resource can easily be used as math HOMEWORK, WARM UPS, or a DAILY MATH REVIEW! This resource was designed to keep math concepts fresh all year and to help you easily track student progress. All pages are 100% EDITABLE and easy to differentiate to fit your students' needs.★ Get the ENTIRE YEAR BUNDLE! {CLICK HERE} ☝☝ Check out the Preview for more details and 3 FREE Weeks! ☝☝This Spiral Review System is also available for LANGUAGE (Grammar & Word Study)Go 10

Finding Slope and Y-Intercept - Equations, Graphs, & Tables for Google Slides™
- Great for online and distance learning! Created to be compatible with Google Slides™!- In this digital activity, students will identify the slope and y-intercept of equations (in slope-intercept form), graphs, and tables.- This activity includes 25 different equations, graphs, and tables over three slides. They will drag and drop the slope and y-intercept to match with its correct equation, graph, or table.Available in the full curriculum bundles below!Pre-Algebra - Curriculum - BUNDLE for Goo
Subjects:
Grades:
7th - 9th
Types:
Also included in: Linear Functions - Unit 4 - BUNDLE for Google Slides™
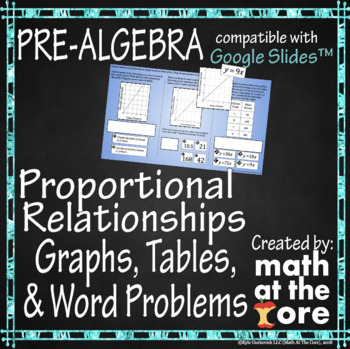
Proportional Relationships - Graphs, Tables, & Word Problems for Google Slides™
- Great for online and distance learning! Created to be compatible with Google Slides™!- In this digital activity, students will identify equations to proportional relationships through graphs, tables, and word problems. Students will also have word problems that they must interpret the relationship and solve problems.- This activity includes 27 different problems to solve over three slides. They will drag and drop the equation to match with its correct graph and table. They will also answer and
Subjects:
Grades:
7th - 8th
Types:
Also included in: Linear Functions - Unit 4 - BUNDLE for Google Slides™
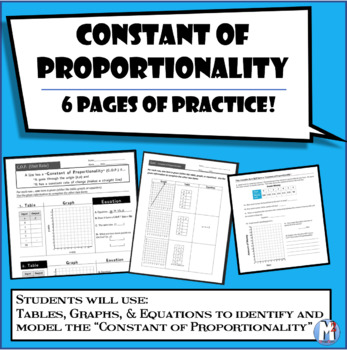
Constant of Proportionality (aka Unit Rate) Six pages of activities!
Tables, Graphs, and Equations (oh my!)Are you looking to teach the Constant of Proportionality (C.O.P.) to your middle schoolers? Well, here you go with 6 pages of student pages! It helped my 7th graders!These pack includes:•2 pages for classroom student practice•2 pages for homework •2 pages for a quiz•Plus an answer key for all of it!-------------------------------------------------Looking for MORE work with Constant of Proportionality?Check out my C.O.P. Task CardsHappy mathing!
Grades:
6th - 10th
Types:
CCSS:
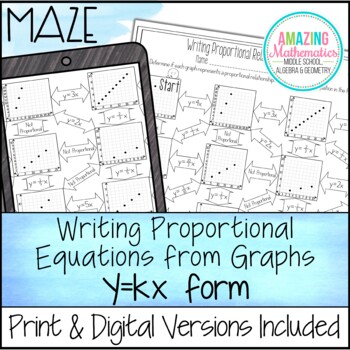
Writing Proportional Relationships From Graphs in y=kx Form Maze worksheet
Printable PDF, Google Slides & Easel by TPT Versions are included in this distance learning ready activity which consists of 11 problems where students must first determine if the graphs are proportional and then write the corresponding proportional equation in y=kx form. This maze will help strengthen your students’ skills at calculating the constant of variation (constant of proportionality) from a graph and writing the corresponding equation.Not all boxes are used in the maze to prevent
Grades:
7th - 8th
Types:
Also included in: 8th Grade Math Bundle ~ All My 8th Grade Math Products at 1 Low Price
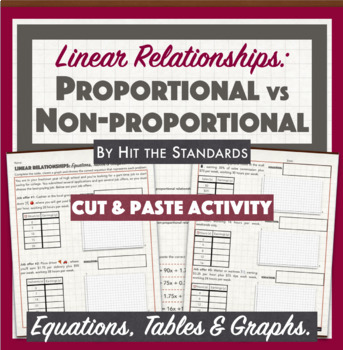
Proportional & Non-proportional Linear Relationships: Equations Tables Graphs
In this cut&paste activity, students must choose the best-paying job out of 5 given options. Each job salary represents a linear relationship, so students must complete a table, create a graph that represents each of them. Also, they must choose the correct equation (cut & paste) that represents each linear relationship. Finally, students must identify the relations as proportional or non-proportional. Hits CC Standards 7.RP.A.2, 8.EE.B.5, 8.F.B.4 & 8.F.B.5 Hits TEKS 8.4B, 8.5A, 8.5
Subjects:
Grades:
7th - 9th
Types:

Fun with Slope: Rate of Change Activities Bundle – Project Based Learning (PLB)
The purpose of the Rate of Change Activities Bundle is to give students the opportunity to use creativity to analyze, graph, and solve rate of change problems in real-world settings. This bundle includes three unique tasks: First Car Mastery Task, i-Logo Slope Mastery Project, and the Raising Puppies Mastery Task. These activities and their accompanying materials are suited for students in grades 7 - 9. The following downloads are included: 1. First Car a. Teacher Instructionsb. Student Workshee
Subjects:
Grades:
7th - 9th
Types:
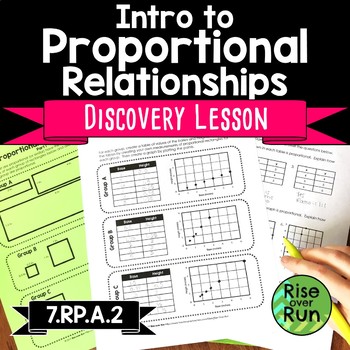
Proportional Relationships Intro Activity & Practice
Give your students a great foundation for making sense of proportional relationships with this discovery activity involving similar rectangles! Students examine and discuss similar figures to get them thinking about proportions. Then they create tables and graphs based on the heights and bases of the shapes. Students will discover how proportional relationships work and what they look like on tables and graphs. The last part is a practice sheet where students identify proportional relationships
Grades:
7th
Types:
Also included in: 7th Grade Math Discovery Lessons and Inquiry Activities Bundle
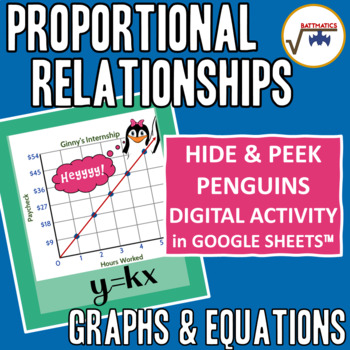
Proportional Relationships Graphs & Equations WINTER DIGITAL SCAVENGER HUNT!
In this DIGITAL, SELF-CHECKING ACTIVITY, students WRITE EQUATIONS (y=kx) TO MODEL the GRAPHS of PROPORTIONAL RELATIONSHIPS and DETERMINE the UNIT RATE from the GRAPH. Designed for DISTANCE LEARNING, it would also function well in a CLASSROOM or HYBRID setting. <===================================================================>A WINNING EQUATION:DIGITAL MAZE + SCAVENGER HUNT = HIDE & PEEK PENGUINS(This activity combines the best features of digital mazes & scavenger hunts to engag
Constant of Proportionality Worksheet
Transform your math class with our engaging worksheet that brings real-world examples and proportional relationships to life! This easy-to-use PDF worksheet features 12 multi-step questions that challenge students to create tables, equations, and graphs to model unit rate, constant rate of change, direct variation, and slope.Perfect for Pre-Algebra classes, this worksheet is an ideal homework or classwork activity that reinforces key concepts and builds problem-solving skills. With both discrete
Grades:
8th
Types:
Also included in: Finding Slope Worksheets Bundle
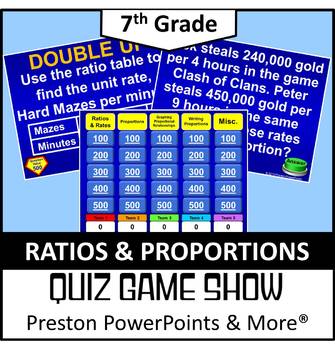
(7th) Quiz Show Game Ratios and Proportions in a PowerPoint Presentation
7th Grade Math Quiz Show Game Ratios and Proportions in a PowerPoint PresentationThis Quiz Show game, Jeopardy Style, is a great way to review a chapter. There are 25 questions and a scoreboard so you don’t have to write the score on a side board. Each page has the point value!This Quiz Show game covers all of the following:Ratios and Rates 7.RP.1, 7.RP.3 Proportions 7.RP.2a, 7.RP.2b, 7.RP.2dWriting Proportions 7.RP.2c, 7.RP.3NEW: The lesson is in an editable format so you can tailor the lesson
Grades:
6th - 8th
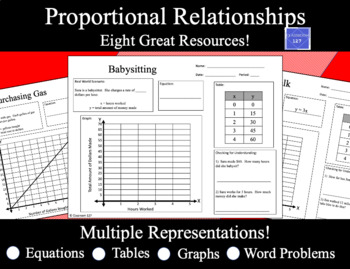
Proportional Relationships Word Problems: Multiple Representations
This product is GREAT at having students make connections between proportional relationships that are expressed in tables, equations, graphs, and word problems.This product contains eight different resources that contain information about proportional relationships. The information is presented to students in only one of four ways. The four ways that students can be presented with information about the real world situation includeBy a word problemBy an equation written in the form y = kxBy a t
Grades:
7th - 8th
Types:
Also included in: Custom Bundle for Chris
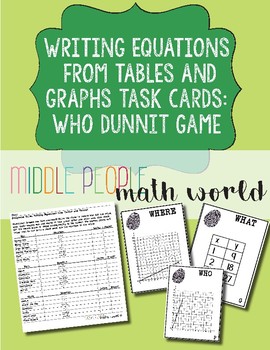
Writing Equations from Tables & Graphs Using Unit Rate Who Dunnit Game
This activity will require students to identify the unit rate in tables and graphs and use the unit rate to write the correct equation. Students will have a blast playing this mathematical version of who dunnit to solve a murder mystery!
NOTE: This activity only includes equations for lines that start at the origin!
Subjects:
Grades:
6th - 8th
Types:
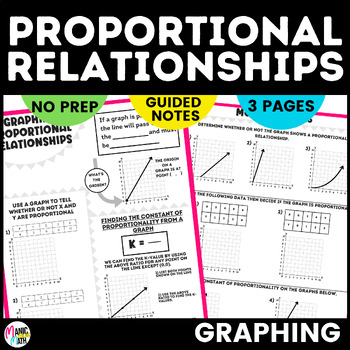
Graphing Proportional Relationships Sketch Notes & Practice
Looking for visually appealing and organized notes to teach graphing proportional relationships? By using these sketch notes to teach graphing proportional relationships your students are sure to be more engaged! These notes teach students how to determine if a relationship is proportional through graphing and how to find the constant of proportionality from a graph. These notes are perfect for middle school and can be used to introduce this topic, as a refresher, or as homework. These notes als
Subjects:
Grades:
7th
Types:
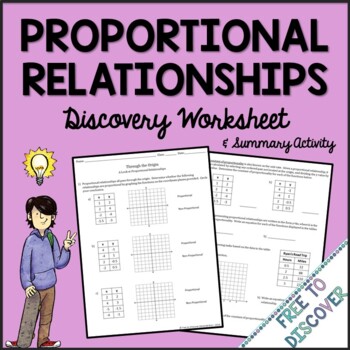
Proportional Relationships Worksheet
In this proportional relationships discovery worksheet, students will test for a proportional relationship by graphing, identify the constant of proportionality from a table, write equations to represent proportional relationships, and explain the meaning of an ordered pair in context. Students will summarize their findings by responding to some prompts in writing and extend their understanding by connecting this concept to percent of change.Included in this product:-2-page worksheet-2-page ans
Subjects:
Grades:
6th - 8th
Types:
Also included in: 7th Grade Math Curriculum Bundle
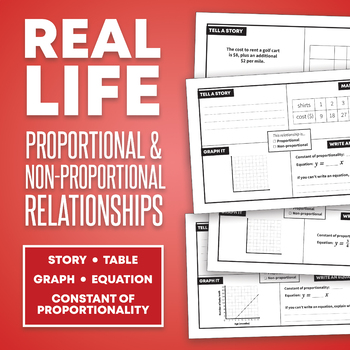
Real-Life Proportional and Non-Proportional Relationships Activity
Help your students see that the same real-life scenario can be represented in many different ways. This unique resource takes six real-life scenarios and asks students to decide if they are proportional or not. Students will describe the scenarios, make a table, graph it, and find the constant of proportionality and equation for each scenario.For some scenarios, students are given a story and asked to produce the table, graph, constant of proportionality, and equation. For others, they are given
Subjects:
Grades:
7th
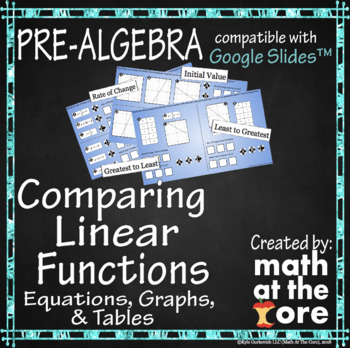
Comparing Linear Functions for Google Slides™
- Great for online and distance learning! Created to be compatible with Google Slides™!- In this digital activity, students will compare linear functions through multiple representations. They will compare the rates of change and the initial value of linear functions through equations, tables, and graphs. Students must be able to compare the magnitude of numbers ordering from least to greatest and greatest to least.- This activity includes 36 different functions to compare in magnitude over five
Subjects:
Grades:
7th - 9th
Types:
Also included in: Linear Functions - Unit 4 - BUNDLE for Google Slides™
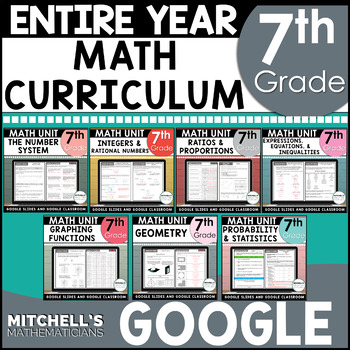
7th Grade Math Curriculum Bundle CCSS Aligned
Looking to integrate technology into your 7th grade math curriculum? This common core aligned product engages your seventh grade students through interactive Google slides. You can assign this to your students digitally or print the slides and distribute them to you students in your classroom. This bundle includes: The number system, integers and rational numbers, percents, ratios, proportions, similar figures, expressions, equations, inequalities, graphing functions, slope, constant of proport
Subjects:
Grades:
7th - 8th
Types:
Showing 1-24 of 215 results


