13 results
Graphing Common Core CCRA.SL.4 resources
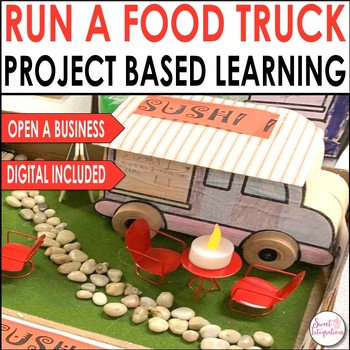
Design and Run a Food Truck STEM With Digital PBL - Project Based Learning Math
Introduce your students to the FOOD TRUCK CRAZE as they master their math and STEM skills through this project based learning math unit. With this math project based learning unit, students will design and run their own food truck! As they plan their final product in this PBL unit, students integrate digital learning by investigating various cultures and diversity and learning about foods from different countries. They will be able to represent a country of their choice, design (STEM) open a fo
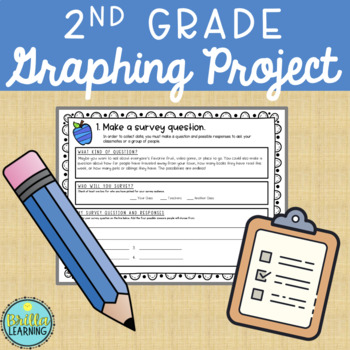
2nd Grade Graphing Project
Engage students with this fun, personalized math project! Students will get to show their knowledge of data and graphs by conducting a survey, gathering the responses, showing it in a graph, and creating some word problems about their graph. They can present it to the class to practice speaking skills as well. For early finishers, a "Challenge Page" is included where they must show their data in a different kind of graph. A 4-1 scale rubric is provided to use this project as a formal assessment
Subjects:
Grades:
1st - 3rd
Types:

School Lunch Menu Data Analysis Project! All included!
Let’s analyze data! This lunch menu project is a great way for students to both analyze and display data in a meaningful way. The attached enrichment project is designed for students, grades 2-5, to work on in math centers, as homework, or as anchor activities in class.
Included:
Cover page
Directions and Expectations Page
Blank Lunch Menu Calendar Page
Project Rubric for Students
Data Information Page to use for Tally Chart and Bar Graph Creation
Instructions for how I use in my class: I b
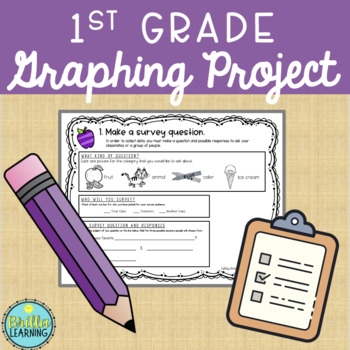
1st Grade Graphing Project
Engage students with this fun, personalized math project! Students will get to show their knowledge of data and graphs by conducting a survey, gathering the responses, showing it in a graph, and creating some word problems about their graph. They can present it to the class to practice speaking skills as well. A 4-1 scale rubric is provided to use this project as a formal assessment if so desired. Included in this resource:List of Vocabulary Words for review Student PagesExample GraphsRubric for
Subjects:
Grades:
1st - 2nd
Types:
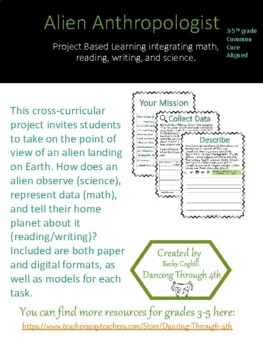
Alien Anthropologist Science, Math, Reading, Writing PBL/ Distance Learning
This cross-curricular project invites students to take on the point of view of an alien landing on Earth. How does an alien observe (science), represent data (math), and tell their home planet about it (reading/writing)? Included are as models for each task and multiple suggestions for extension activities. My 4th graders loved this project and were able to write strong, 1st person point of view descriptions with only minimal support from me! This is engaging for students and low-prep for the t

Getting & Graphing Your Plant & Animal Data Outside - Remote-Ready STEM/STEAM
This bundle gets your kids outside safely and ethically collecting data and assessing the health of their local biodiversity and primes the pump for any of my Nature STEAM, student-driven projects. First, students learn how modern biodiversity data collection is a lot safer (for biologists AND their subjects) than it was in history. After viewing my Silly Skits Video your kids use humor to dramatize how to act safely and ethically in their outdoor wild before collecting their own citizen-science
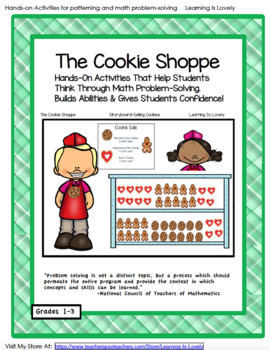
The Cookie Shoppe: Build Math Problem-Solving and Critical Thinking Skills
This is a supplementary unit that believes in students learning “a mile deep” not a mile long. This unit is designed to help students take the fear out of math problem solving, develop listening and speaking skills and build math vocabulary. Using this supplemental math resource, your students will gain confidence in their math problem-solving abilities, develop higher level critical thinking skills, and do so while developing growth mindset attitudes. Students will use a cookie theme to solve p
Subjects:
Grades:
1st - 3rd
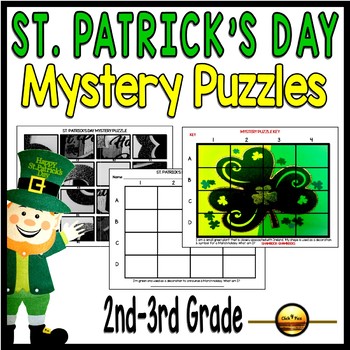
St Patricks Day Coordinate Graphing Picture Activities 2nd and 3rd Grade
Saint Patrick's Day Mystery Puzzles for 2nd and 3rd grade students teach important math skills using fun print and go activities. Students will use Ordered Paris on a 16 Coordinate Graph to solve St. Patty's Day Puzzles. These hands-on, cut and paste holiday math activity comes in color, black and white, and includes completed Answer Keys.St. Patrick's Day Mystery Puzzle Packet Includes:Four Color St. Patty's Day Puzzles Four Black and White St. Patty's Day PuzzlesAnswer KeysMystery Riddles for
Subjects:
Grades:
2nd - 3rd
Types:
Also included in: St. Patricks Day March Reading and Math Centers 2nd and 3rd Grade
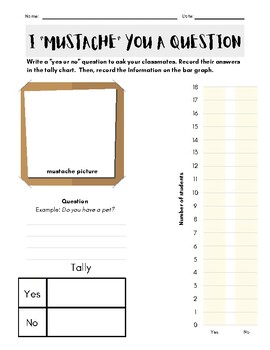
I "mustache" you a question Graphing
Practice graphing, tally charts, writing questions, and speaking skills. Have students wear a mustache or draw one! Students will come up with a "yes or no" question and interview their peers. They will tally responses and use the data to create a bar graph.
Subjects:
Grades:
K - 3rd
Types:
Easter Mystery Puzzles Centers and Activities
Five Easter Math Mystery Puzzle Activities to keep your Kindergarten and first grade students learning this Spring! Students and teachers love how easy and educational these Easter Graphing Puzzles are for math centers, early finishers, and Easter Parties!This Easter Math Packet Includes:Teacher Instructions and IdeasMystery Puzzle ONE Storage CoverMystery Puzzle ONE Answer KeyMystery Puzzle ONE Student Print and Go Puzzle SheetMystery Puzzle ONE Student Print and Go Puzzle Grid SheetMystery Pu
St Patricks Day Coordinate Graphing Picture Activities Kindergarten First Grade
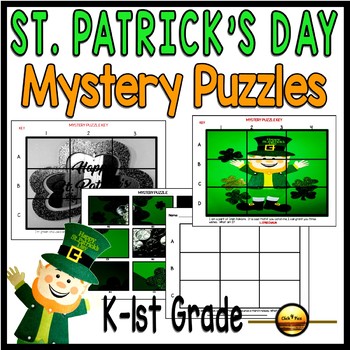
Fun Print and Go March Activities for kindergarten and first grade students for St. Patrick's Day. These nine coordinate grid Mystery Puzzles teach students how to cut and glue holiday pictures using a nine grid map sheet to problem solve. St. Patrick's Day Mystery Puzzle Packet Includes:Four Color St. Patty's Day Puzzles Four Black and White St. Patty's Day PuzzlesAnswer KeysMystery Riddles for the Four Puzzles Benefits of this Product:teaching students how to read map gridsteaching students ho
Subjects:
Grades:
K - 1st
Types:
Also included in: St Patricks Day March Reading and Math Centers Kindergarten First Grade

Weather Patterns - The Young Child Uses Their Own Data- STEM / STEAM Lesson 17
In this lesson, your students look for patterns revealed on their collected Daily Data sheets. First, they will use themselves as movable counting blocks to help think about how the weather affects their own behaviors. Then they analyze, graph, and interpret their accumulated Daily Data to reach logical conclusions about how changes in weather affect the local plants and animals in their schoolyard or backyard. Includes:Detailed Lesson PlanWeather & You Chart and QuestionsWhat Do You Wear C
Subjects:
Grades:
PreK - 6th
Types:
NGSS:
K-ESS2-1
, 3-ESS2-1
, K-LS1-1
United States Census - Understanding Population Change
Do you want a quick and easy way to discuss the importance of the US Census with your third or fourth graders? If so, consider this resource. By the end of the lesson, students will be able to:•Understand why the United States Census is important•Draw conclusions from data to answer questions•Graph data on a chart
Subjects:
Grades:
3rd - 4th
Showing 1-13 of 13 results


