1,411 results
6th grade statistics resources for Google Apps
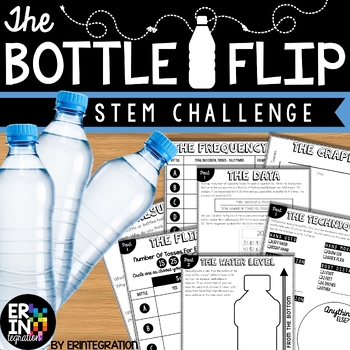
Water Bottle Flip STEM Challenge + STEM Activity
The ORIGINAL water bottle flip STEM activity and lab! Water bottle flip at school? Absolutely! Students will love this on-trend STEM challenge inspired by the popular YouTube water bottle flipping challenge where students toss a water bottle and attempt to land it straight up. Practice scientific method with some probability, fractions and data collection in the mix while having fun!This self-paced, low-prep, project based learning water bottle flip STEM challenge is print-and-go. Each activit
Subjects:
Grades:
3rd - 6th
Types:
CCSS:
NGSS:
K-2-ETS1-2
, K-2-ETS1-3
, MS-ETS1-2
, K-2-ETS1-1
, 3-5-ETS1-3
...
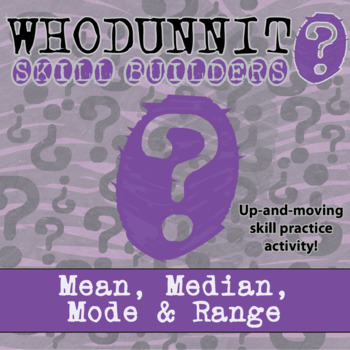
Mean, Median, Mode & Range Whodunnit Activity - Printable & Digital Game Options
Nothing like a good criminal investigation to liven up mean, median, mode, and range! Based off my popular CSI projects, I have created Whodunnits? The Whodunnits plan to focus on single content topics as opposed to units and will focus more on skill building than application. Every day can't be a project day, so Whodunnits can be an engaging out of their seat activity to practice important skills. In a Whodunnit?, students will work in teams to solve 10 practice problems that increase in diffic
Subjects:
Grades:
6th - 12th
Types:
Also included in: Pre-Algebra Whodunnit Activity Bundle - Printable & Digital Game Options
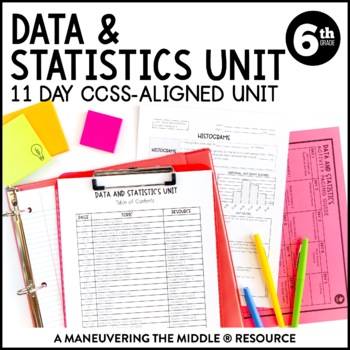
Data & Statistics Unit | Measures of Center, Dot and Box Plots, & Histograms
An 11 day CCSS-Aligned Statistics Unit - including statistical questions, describing data, and analyzing data with dot plots, box plots, and histograms. Students will understand measures of center and variability and how they relate to displays of data. Students will practice with both skill-based problems, real-world application questions, and error analysis to support higher level thinking skills. You can reach your students and teach the standards without all of the prep and stress of creatin
Subjects:
Grades:
6th
Types:
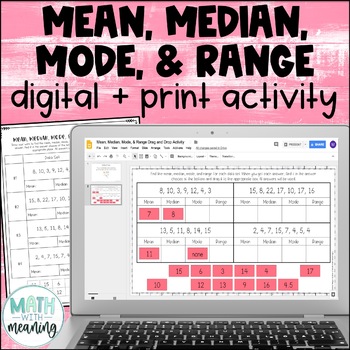
Mean, Median, Mode, & Range Digital and Print Activity for Google Drive
Looking for a fun, no-prep activity for finding mean, median, mode, and range? Students will find the mean, median, mode, and range for 4 data sets. They will then then find their answer from the answer choices at the bottom and drag it to the appropriate spot. Each data set contains 6-8 numbers. Please view the preview file to make sure that this activity is appropriate for your students.This product includes the following:A link to the digital activity on Google Slides including student direct
Subjects:
Grades:
5th - 8th
CCSS:
Also included in: Middle School Math Digital and Print Activity Bundle Volume 1
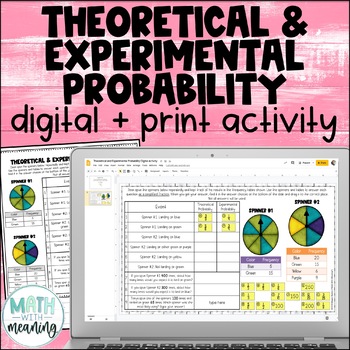
Theoretical and Experimental Probability Digital and Print Activity
Looking for an engaging, no-prep activity to practice working with theoretical and experimental probability? Students will use two sets of spinners and frequency tables to answer questions in this fun digital and print activity.This activity requires students to find the theoretical and experimental probabilities of simple events and to use theoretical probabilities to make predictions. Please view the preview file to make sure that this activity is appropriate for your students.This product inc
Subjects:
Grades:
5th - 8th
CCSS:
Also included in: Middle School Math Digital and Print Activity Bundle Volume 3
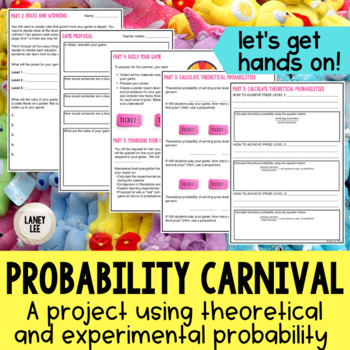
Probability Carnival Game Project - PDF & Digital
Looking for a fun, hands on way to bring probability to life? Are you ready to move past the "sit and get" style of whole group instruction? If you answered yes to either of those questions, then this resource is for you!Keep your students engaged and accountable with the interactive, versatile Probability Carnival! The steps of this project are designed to be rigorous and require students to predict, reflect, connect, and think critically about the situations being investigated.Using this proje
Subjects:
Grades:
6th - 8th
Types:
Mean Median and Mode Math Mystery Game Activity - 6th Grade Math Edition
Mean, Median, and Mode Review Activity - 6th Grade Edition: The Case of Mean Mountain. Engage and motivate your students with this fun math mystery activity! Great for practice and review! Now available with printable and digital worksheets! Easy prep! Just Print the worksheets & Solve! Or go paperless with the new Google Slides option provided within your download.--------------------------------------------------------------------------------------------⭐Optional video hook included for i
Subjects:
Grades:
5th - 8th
Types:
Also included in: 6th Grade COMPLETE Math Mystery Bundle CSI Math Review Activities
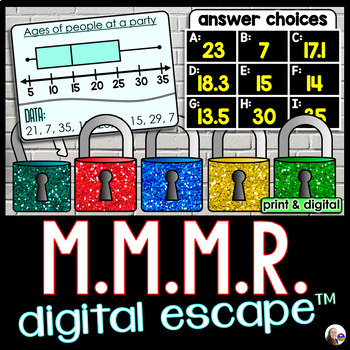
Mean Median Mode and Range Digital Math Escape Room Activity
An engaging math escape room for reviewing measures of central tendency. Students must unlock 5 locks by finding mean, median, mode and range in 5 sets of data. Questions are grouped 4 per puzzle, resulting in five 4-letter codes that will unlock all 5 locks.Data is presented in:stem and leaf plot, raw data set, box and whiskers plot, tabledot plot. The entire activity is housed in one GOOGLE Form. There are no links to outside websites. The 4-letter codes are set with answer validation so that
Subjects:
Grades:
6th - 8th
Types:
Also included in: Middle School Math Digital Activities Bundle
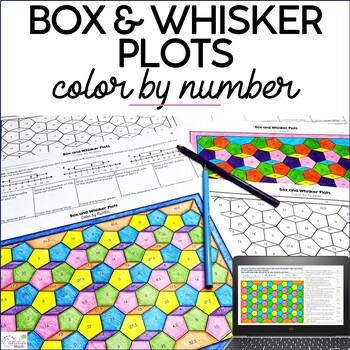
Box and Whisker Plots Color by Number Activity 6th Grade Math Coloring Pages
This box and whisker plots color by number activity includes two print and one digital version, offering engaging and versatile practice, while adding the mindfulness, wellness, and quietness coloring brings.Coloring in math has been shown to help reluctant students feel more comfortable with math:-)The box and whisker plot problems require students to identify:First quartile MedianThird quartile Interquartile rangeRange MinimumMaximum Number that would be in each quartile, based on a number of
Subjects:
Grades:
6th - 7th
Types:
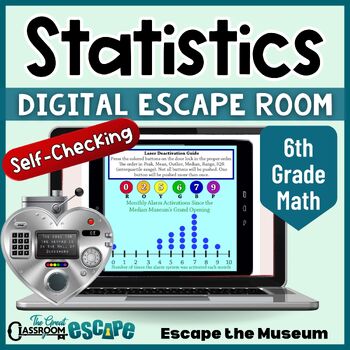
6th Grade Math Data Analysis & Statistics Activity Digital Escape Room Game
Find the median, read the box plot, interpret the frequency table, and unlock the door! This 6th grade math activity based on statistics and probability standards will put your students statistical skills to the test. Your students are volunteer docents at the Median Museum. After the security system locks everyone in, they will need to use their knowledge of statistics to escape the museum. This engaging digital escape room is easy for teachers to implement. The breakout process is fully autom
Subjects:
Grades:
6th - 7th
Types:
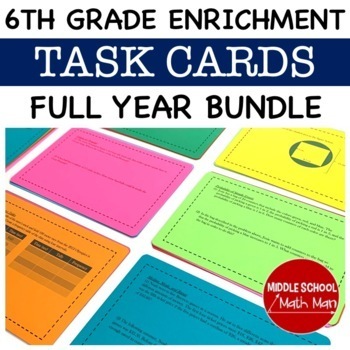
6th Grade Math Task Cards | Math Enrichment Task Card Activities Bundle
These 6th grade math task card activities include 87 different challenging task cards to use as review, enrichment, math centers, or with early finishers. The task cards are designed specifically for 6th grade math topics. Concepts include geometry, algebra, numbers and operations, statistics, and other standards listed below. All task cards include a digital Google slides and printable option.Save 40% and get the majority of my math products, including this resource, at a large discount by purc
Subjects:
Grades:
5th - 8th
Types:
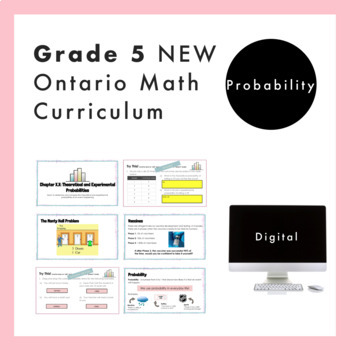
Grade 5 Ontario Math - Probability Curriculum - Digital Google Slides+Form
Are you planning for the NEW Grade 5 Ontario Math Curriculum? This fully editable, NO PREP Google Slide resource is what you need! This resource is for the DATA strand and covers all specific expectations for “D2. Probability”. In this resource, students will experience math through engaging real-life questions, storytelling through math, and interactive slides. For teachers who are given Nelson© Math by your board, this resource loosely follows the order of the Probability chapter (Chapter 13)
Subjects:
Grades:
4th - 6th
Also included in: Grade 5 NEW Ontario Math Curriculum Full Year Digital Slides Bundle
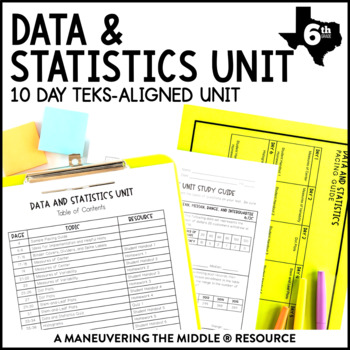
Data and Statistics TEKS Unit | Stem & Leaf Plots, Histograms, Frequency Tables
A 10 day Data and Statistics TEKS-Aligned complete unit including: measures of center, measures of variability, dot plots, stem-and-leaf plots, histograms, and categorical data.Students will practice with both skill-based problems, real-world application questions, and error analysis to support higher level thinking skills. You can reach your students and teach the standards without all of the prep and stress of creating materials!Standards: TEKS: 6.12A, 6.12B, 6.12C, 6.12D, 6.13A, 6.13B; Lookin
Subjects:
Grades:
6th
Types:
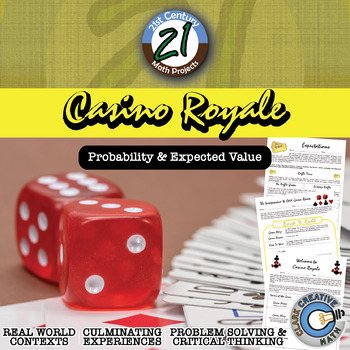
Casino Royale -- Expected Value & Probability Game - 21st Century Math Project
Your students might be begging for for a day for them to play games. Let it be on your terms in this 21st Century Math Project! This Expected Value and Probability Project focuses on one of the more emphasized aspects of the Common Core Standards. Students will be asked to design their own games with defined expected value and host it in a Game Day event! The student that collects the most "Swagg Cash" will forever (or at least for 36 hours) be known as the Master of Swagg. ***THIS PRODUCT HAS B
Subjects:
Grades:
6th - 12th
Types:
CCSS:
Also included in: Probability & Expected Value Unit Bundle - Distance Learning Compatible
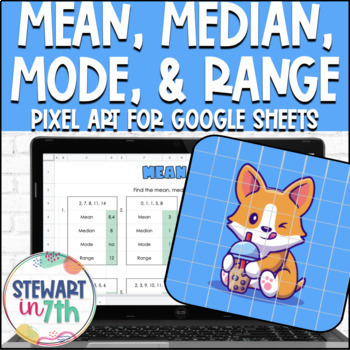
Mean, Median, Mode, Range Digital Pixel Art Activity
In this digital activity, students find the mean, median, mode, and range of 12 different sets of data. NO PREP is required - activity is ready to share with students as-is! This activity is self checking; students are able to receive immediate feedback. Incorrect answers turn the answer box red, while correct answers fill in the image. Teachers can easily see how far students have progressed, as well as problem areas. This is a great activity for virtual or in person learning!A printable recor
Subjects:
Grades:
6th - 7th
Types:
Also included in: 7th Grade Statistics Digital Activity Bundle
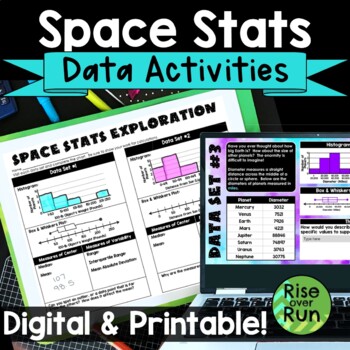
Box and Whiskers Plots and Histograms Activity with Real World Space Statistics
Use statistics for a real world application with this engaging activity about space stats! Students use real data to create histograms, box and whiskers plots, as well as calculate median, mean, range, interquartile range, and mean absolute deviation. This lesson works great for a space room transformation if you choose! Components are included in printable versions for in-person learning and Google Slides + Microsoft PowerPoint for online learning.Here’s what is included:Intro Presentation (Po
Subjects:
Grades:
6th - 9th
Types:
Also included in: Algebra 1 and 8th Grade Math Curriculum Bundle for Entire Year
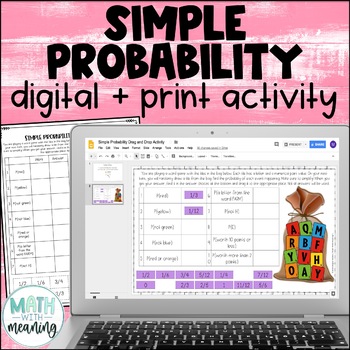
Simple Probability Digital and Print Drag and Drop Activity for Google
Looking for an engaging, no-prep activity to practice finding the probability of simple events? Students will use the included image to find the probability of 10 simple events. They will then find their answer from the answer choices at the bottom and drag it to the appropriate spot. Please view the preview file to make sure that this activity is appropriate for your students.This product includes the following:A link to the digital activity on Google Slides including student directionsA PowerP
Subjects:
Grades:
5th - 8th
CCSS:
Also included in: Middle School Math Digital and Print Activity Bundle Volume 1
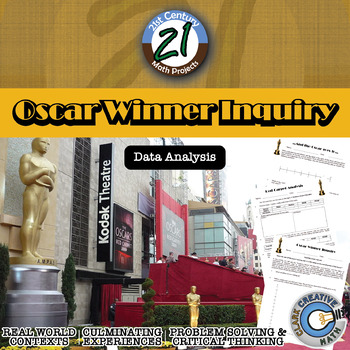
Oscar Winner -- Data Analysis & Statistics Inquiry - 21st Century Math Project
Utilize the last twenty years of Oscar winners as a data set to guide your students through creating box and whisker plots, histograms, and exploring mean, median, and mode -- in one 21st Century Math Project!Does the age of the award winning star in a film relate to the overall gross of the movie? Student will explore this inquiry question and use the data to support their conclusion.In this 8 page document you will be given a mapping to the Content Standards, an outline for how to implement t
Subjects:
Grades:
6th - 12th
Types:
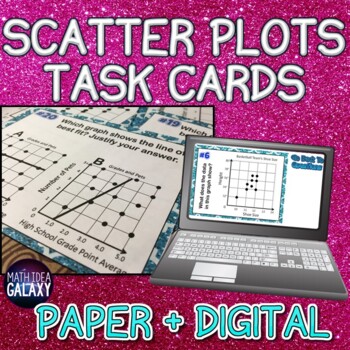
Scatter Plots Task Cards- Printable & Digital Resource
This is an engaging activity for students to practice reading and interpreting scatterplot graphs. Students will practice scatter plots in a variety of ways; these task cards can be used as a game, a center or station, a whole class activity, independent work, or partner practice for concepts related to scatter plots and the line of best fit.These task cards come in both printable AND digital formats. The digital format is built in Google Slides to easily assign to students, and includes answers
Subjects:
Grades:
6th - 8th
Types:
CCSS:
Also included in: Scatter Plots Activity Bundle
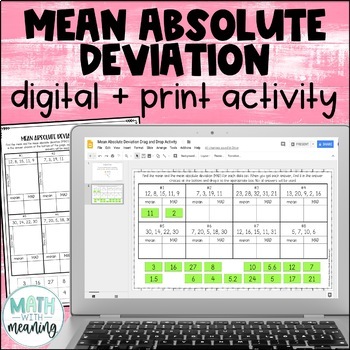
Mean Absolute Deviation MAD Digital and Print Activity for Google Drive
Looking for an engaging, no-prep activity to practice finding the MAD? Students will find the mean and mean absolute deviation for 8 data sets. They will then then find their answer from the answer choices at the bottom and drag it to the appropriate spot. Each data set contains 4-5 numbers. The mean of each data set is a whole number. Please view the preview file to make sure that these types of problems are appropriate for your students.This product includes the following:A link to the activit
Subjects:
Grades:
6th - 9th
CCSS:
Also included in: Middle School Math Digital and Print Activity Bundle Volume 2
Stem and Leaf Plots Whodunnit Activity - Printable & Digital Game Options
Nothing like a good criminal investigation to liven up stem and leaf plots! Based off my popular CSI projects, I have created Whodunnits? The Whodunnits plan to focus on single content topics as opposed to units and will focus more on skill building than application. Every day can't be a project day, so Whodunnits can be an engaging out of their seat activity to practice important skills. In a Whodunnit?, students will work in teams to solve 10 practice problems that increase in difficult. After
Subjects:
Grades:
5th - 10th
Types:
CCSS:
Also included in: Pre-Algebra Whodunnit Activity Bundle - Printable & Digital Game Options

Google Sheets Digital Pixel Art Math Finding the Mean Median Mode Range
Students will calculate the MEAN, MEDIAN, MODE and RANGE of 5 sets of data to reveal a pixel art design via Google Sheets. This pixel art resource currently contains just one Level. Correct answers will be indicated by the text color changing from red to black with a green highlight and students will be rewarded with colored pixels appearing in the mystery image. Incorrect answers will be indicated by the text color staying red and colored pixels will not be rewarded.The mystery pixel art imag
Subjects:
Grades:
5th - 8th
Types:
Also included in: CUSTOM BUNDLE for LAYNE W.
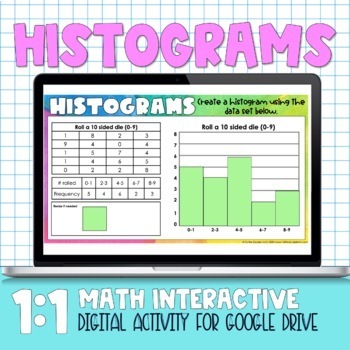
Histograms Digital Practice Activity
Histograms Digital Practice ActivityThis product is a Google Slides product- students can complete it digitally. Included in this product: -4 different histogram problems- students have to drag and drop to create histogram plots-4 page printable version-Answer KeysCheck out my other Distance Learning Digital Products Here
Subjects:
Grades:
6th - 7th
Also included in: Statistics Digital Activities

Box and Whisker Plots Puzzle Digital Pixel Art Activity | Distance Learning
Students will find the minimum, median, maximum, first and third quartile from each given set of numbers and interpret box plots. This Google Sheet(TM) activity is no prep, can be assigned in seconds on Google Classroom, and is a breeze to grade. Students will be amazed as more of the picture reveals with each correct answer. Students will have fun while getting immediate feedback on their understanding! Every time they enter a correct answer more of the picture will be revealed and the cell wil
Subjects:
Grades:
6th - 7th
Types:
CCSS:
Also included in: 6th Grade Math Picture Pixel Art Digital Activities Google Classroom
Showing 1-24 of 1,411 results


