1,580 results
7th grade graphing lessons

Kinetic Energy Graphing and Analyzing Relationships of Mass and Speed MS PS3-1
Do you need to teach about kinetic energy? This resource is on kinetic energy and its relationship to mass and speed. Students will analyze graphs and construct graphs to show that mass and speed increase kinetic energy. This resource starts with a slide show on kinetic energy and phenomena. Students will love learning about kinetic energy.This resource includes:a slide showstrategic notetaking guideresponse pagesquizanswer keysTeachers Love This Resource!Edith ⭐️ ⭐️ ⭐️ ⭐️ ⭐️ Extremely Satisfied
Subjects:
Grades:
6th - 8th
Types:
NGSS:
MS-PS3-1
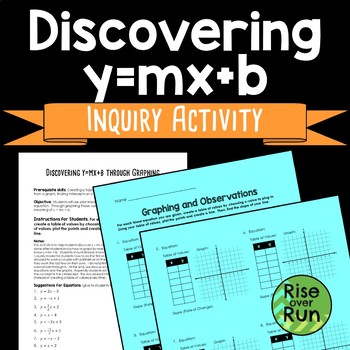
Discovering y=mx+b through Graphing, Slope Intercept Form
This activity will help students discover the slope and y-intercept of slope-intercept form. Students will use prior knowledge of creating a table of values from an equation. Through graphing those values, student will observe and discover the meaning of y = mx + b, slope-intercept form. This activity is to help students discover y = mx + b without being told its meaning. It should be done after students know how to graph by making a table of values, but before students know y = mx + b. Stude
Grades:
7th - 8th
Types:
CCSS:
Also included in: 8th Grade Math Discovery Lessons and Activities Bundle
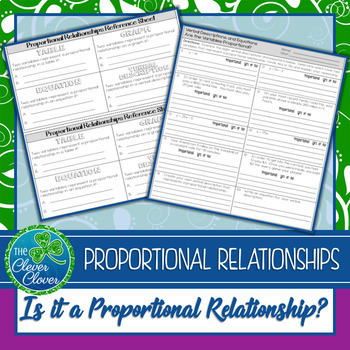
Proportional Relationships - Equations, Tables and Graphs
Use this quality resource to have students be able to identify proportional relationships in equations, tables and graphs! Included, you will have a reference sheet, worksheets, exit slips and an assessment. This no-prep product can help your students identify proportional relationships! You can save 20% by purchasing this resource in one of the following bundles. Check them out!• Proportional Relationships in Tables, Graphs and Equations Mini-Bundle• Ratios and Proportional Reasoning BundlePle
Subjects:
Grades:
6th - 8th
Types:
CCSS:
Also included in: Proportional Relationships in Tables, Graphs and Equations Mini-Bundle
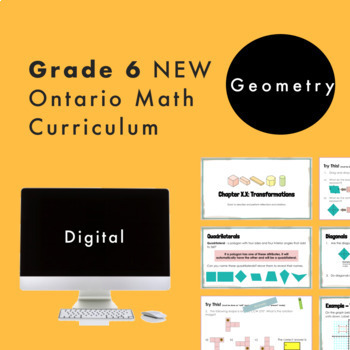
Grade 6 Ontario Math - Geometry Curriculum - Digital Google Slides+Form
Are you planning for the NEW Grade 6 Ontario Math Curriculum? This fully editable Google Slide resource is what you need! *Note that this contains NEW lessons with added expectations from the new curriculum. This resource is for the SPATIAL SENSE strand and covers ALL specific expectations for “E1. Geometric and Spatial Reasoning”. In this resource, students will experience math through engaging real-life questions, storytelling through math, and interactive slides. For teachers who are given N
Grades:
5th - 7th
Types:
Also included in: Grade 6 NEW Ontario Math Curriculum Full Year Digital Slides Bundle
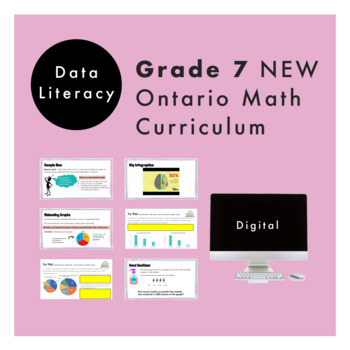
Grade 7 Ontario Math - Data Literacy Curriculum - Digital Google Slides+Form
This resource is for the Grade 7 DATA strand and covers ALL specific expectations for “D1. Data Literacy”. Do you need a practical and engaging resource for the NEW Ontario Math Curriculum? This NO-PREP, editable Google Slide resource is what you need! In this resource, students will experience math through engaging real-life questions, storytelling through math, and interactive slides. For teachers who are given Nelson© Math by your board, this resource loosely follows the order of the Data Ma
Subjects:
Grades:
6th - 8th
Types:
Also included in: Grade 7 NEW Ontario Math Curriculum Full Year Digital Slides Bundle
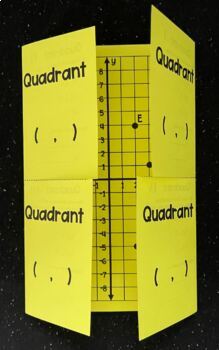
Coordinate Plane - Editable Foldable Notes
This editable foldable provides students with an introduction and an organized set of notes and practice on the coordinate plane. I have the students label each of the four quadrants on the front flap. They will also write the sign of the coordinates necessary for the given quadrant. Inside the foldable, students label the x-axis, y-axis, origin, and graph (and label) the coordinates as well as identify the coordinates of points already plotted.This is perfect for interactive math notebooks.
Grades:
5th - 8th
Types:
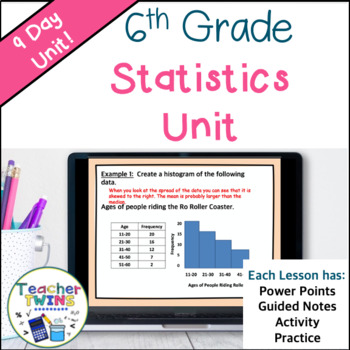
Statistics Unit Grade 6 - Mean - Median - Mode - Histograms - Box Plots
Make lesson planning easy with this no-prep Statistics - Mean, Median, Mode - Histograms - Box Plots Unit! Included are 9 ready-made lessons to teach finding the mean, median, and mode as well as interpreting and creating dot plots, histograms, and box-and-whisker plots. This unit is very easy to use and will save you a lot of time! Your students will learn how to find mean, median, and mode and interpret box-and-whisker plots by using our editable PowerPoints with guided notes. Students will lo
Grades:
5th - 7th
Also included in: 6th Grade Math Curriculum Bundle
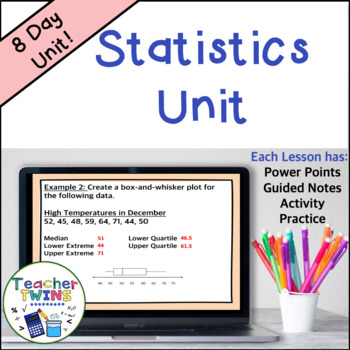
Statistics Unit - Mean Absolute Deviation - Populations and Samples - Box Plots
Make lesson planning easy with this no-prep Statistics - Mean Absolute Deviation - Populations and Samples - Box-and-Whisker Plots Unit! Included are 8 ready-made lessons to teach finding mean absolute deviation as well as interpreting and creating box-and-whisker plots. This unit is very easy to use and will save you a lot of time! Your students will learn how to find mean absolute deviation and interpret box-and-whisker plots by using our editable PowerPoints with guided notes. Students will l
Subjects:
Grades:
6th - 8th
Also included in: 7th Grade Math Curriculum Bundle
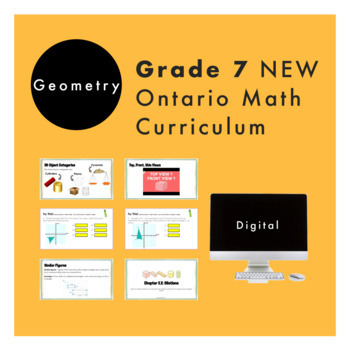
Grade 7 Ontario Math - Geometry Curriculum - Digital Google Slides+Form
Do you need a practical and engaging resource for the NEW Ontario Math Curriculum? This fully editable Google Slide resource is what you need! This resource is for the Grade 7 SPATIAL SENSE strand and covers ALL specific expectations for “E1. Geometric and Spatial Reasoning”. In this resource, students will experience math through engaging real-life questions, storytelling through math, and interactive slides. For teachers who are given Nelson© Math by your board, this resource loosely follows
Grades:
6th - 8th
Types:
Also included in: Grade 7 NEW Ontario Math Curriculum Full Year Digital Slides Bundle
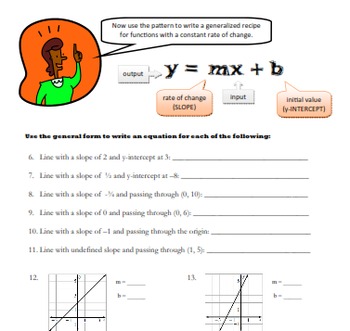
Writing Linear Equations in Slope Intercept Form y=mx+b (a mini unit)
16 pages. This mini-unit (3 days) introduces the y=mx+b form as a general formula for linear functions. From this form, students learn to write equations for linear functions given:
* Slope and y-intercept
* Slope and a point on the line
* Two points on a line
It is designed for introductory algebra students who already have familiarity with:the definition of a function (but not necessarily function notation), coordinate graphing, identifying slope of a linear function from a gr
Grades:
7th - 10th
Types:
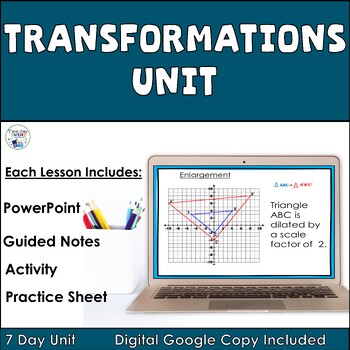
Transformations (Reflections, Rotations, Translations, Dilations) 8th Grade Unit
Make lesson planning easy with this no prep Transformations - Reflections, Rotations, Translations, and Dilations Unit! Included are 7 ready-made lessons to teach reflections, rotations, translations and dilations to your students. This unit is very easy to use and will save you a lot of time!Teach your students about reflections, rotations, translations and dilations by using our editable PowerPoints with guided notes. Students will love learning about transformations when you use the included
Grades:
6th - 8th
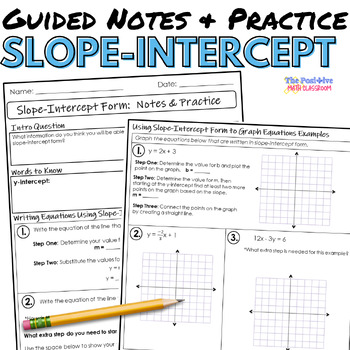
Slope Intercept Form Guided Notes and Practice
Print and go with this set of guided notes and practice. These easy to use notes cover how to write linear equations in slope intercept form as well as how to graph the line based on this form. Best of all, these sheets will help organize your student's notes and give them confidence with such an important algebra concept. This set of notes includes:Intro Question: Helps your students to make a connection to new informationWords to Know: Highlights essential terms in the lessonExamples: Guided
Grades:
7th - 9th
Types:
CCSS:
Also included in: Slope and Graphing Linear Equations Bundle
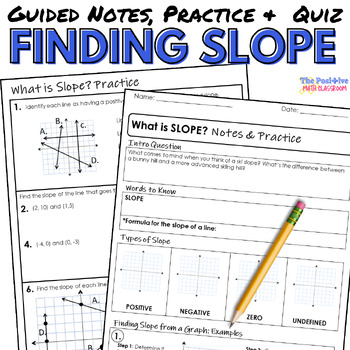
Finding Slope Guided Notes and Practice
These guided notes will be a perfect introduction to slope for your students. Print and go with these notes that will help organize your students' thinking as well as give them practice on types of slope and how to find the slope of a line. Also included is a quiz to assess students' understanding. The guided notes are organized in the following way:Intro Question: This helps your students to make a connection to new information.Words to Know: Highlights essential terms in the lesson.Examples:
Grades:
7th - 9th
Types:
Also included in: Slope and Graphing Linear Equations Bundle
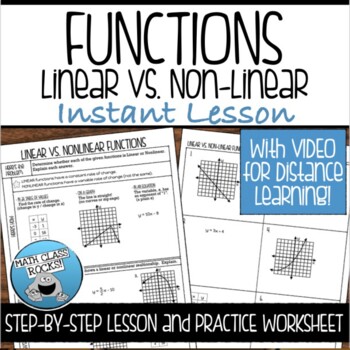
LINEAR VS NONLINEAR FUNCTIONS GUIDED NOTES AND PRACTICE
Save time and make your life easy with these LINEAR VS NONLINEAR FUNCTIONS GUIDED NOTES and PRACTICE WORKSHEET! Perfect for introducing a new concept, reviewing a previously learned skill, or your interactive notebook! These guided notes will simplify every lesson with step-by-step examples and practice problems to provide a year-long resource for your students to refer to again and again!This lesson is included in my Functions Instant Lesson BUNDLE. Click HERE to view this resource and SAVE 2
Grades:
7th - 9th
CCSS:
Also included in: 8th GRADE MATH GUIDED NOTES AND PRACTICE FULL YEAR BUNDLE
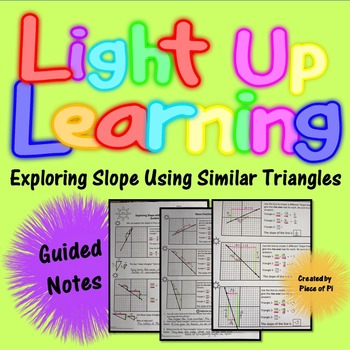
Slope Similar Triangles with VIDEO UPDATE Guided Notes Distance Learning 8.EE.6
Explore Slope using Similar Triangles. Guided Notes. Color Coding with Highlighters! Common Core Standard 8.EE.6. Keeps students engaged as they learn and explore new concepts. This color-coding technique works well with students of all levels! The recent addition of 2 instructional videos can help with distance learning, student review, and sub plans!Bundled for Savings!Slope Similar Triangles Notes and HomeworkLight up their learning! This technique has worked beautifully with my special-educa
Grades:
7th - 9th
Types:
CCSS:
Also included in: 8th Grade Math Review Activities Notes Mega Bundle
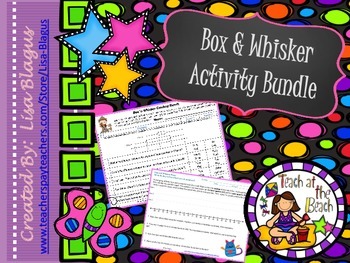
Box and Whisker Plot Activity Bundle
This 21 page mini-lesson/bundle has 3 engaging assignments. Students are expected to find measures of central tendency, while creating and interpreting box and whisker plots. The activities are:
A group project where students use foldable strips to find their own minimum, maximum, and median, and then plot their own box and whisker plots.
They will also take data from local restaurants, find the central tendencies of the data and create box and whisker plots.
Lastly, students are expected t
Grades:
6th - 9th, Adult Education
Types:
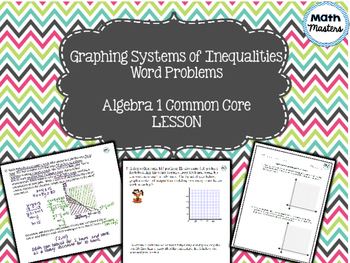
Graphing Systems of Inequalities Word Problems
This is an Algebra 1 Common Core Lesson on setting up, graphing & solving systems of inequalities from real life situations. After a few teacher led examples, students will practice on their own or in groups.
Includes:
-Lesson & Teacher Answer Key PDF
-Lesson & Teacher Answer Key Smartnotebook File
-Student Worksheet PDF
-Homework Worksheet
-Homework Answer Key
To practice graphing systems of inequalities without word problems please Click here!
**These lessons are part of the
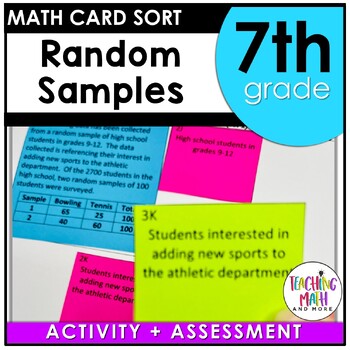
Random Samples & Populations Card Sort Activity Lesson
This lesson unit is intended to help you assess how well students are able to understand that statistics can be used to gain information about a population by examining a sample of the population; generalizations about a population from a sample are valid only if the sample is representative of that population. Understand that random sampling tends to produce representative samples and support valid inferences. Use data from a random sample to draw inferences about a population with an unknown c
Subjects:
Grades:
7th
Types:
Also included in: Math Card Sort Activity Grade 7 BUNDLE
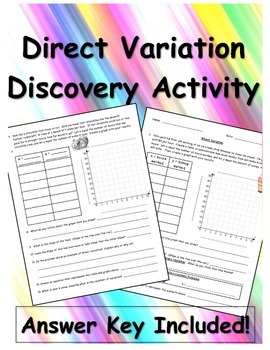
Direct Variation Discovery Activity
Allow students to discover direct variation through this activity! Students will be given two scenarios where they must fill in a table and a graph to see that the coordinates create a straight line through the origin. Students will discover the direct variation equation.
Analyzing Data BUNDLE: A Scientific Method Resource
This bundle contains resources to introduce, practice, and assess the analyzing data step of the scientific method in your middle school science classroom. Two interactive notebook pages will introduce the purposes of bar graphs, line graphs, and pie charts and what makes a good graph. The editable 29 slide PowerPoint can be used to guide students during their notetaking in their INBs or can be used separately to review and practice the material covered in the notes. Two different worksheets wil
Subjects:
Grades:
5th - 8th
NGSS:
MS-ETS1-3
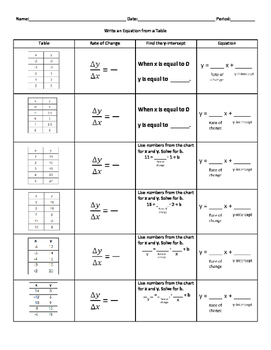
TEKS 7.7A Writing a Linear Equation from a Table
This is a guided practice page intended for students to learn to be comfortable finding the y-intercept and the rate of change/slope in order to write an equation in the form y=mx+b. It gradually releases students to fill in information on their own and increases in complexity throughout.
Grades:
7th - 9th
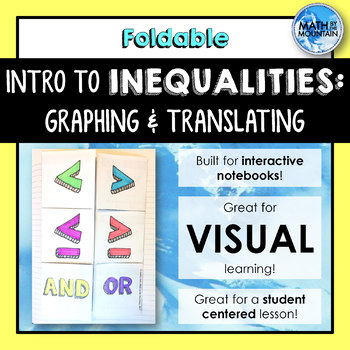
Intro to Inequalities - Graphing and Translating Foldable
This intro to inequalities foldable covers a brief introduction to graphing inequalities in one variable. Students learn whether to use an open or a closed point, and keywords that translate to the various inequalities. Each of the four inequality symbols are included, as well as compound "and" and "or" inequalities. Two different font options are included for the front flaps of the foldable. This foldable is perfect for a standalone lesson, review at the end of a unit, part of a stations act
Grades:
6th - 9th
CCSS:
Also included in: Unit 3 - Solving Multi-Step Inequalities - Interactive Notebook Kit
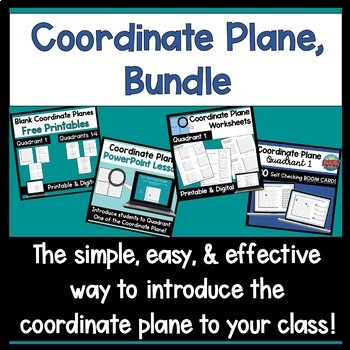
Coordinate Grid Quadrant 1 Bundle
This bundle deals mostly with quadrant one of the coordinate plane.The resources include:Free Blank coordinate planes/coordinate grids in printable and digital formatsIntroduction to Coordinate Graphing PowerPointPrintable & Digital Coordinate Plane Quadrant 1 WorksheetsCoordinate Plane Quadrant 1 Boom CardsBuy these in the bundle to get them at 30% off!*While the title says "Quadrant 1 Bundle," the printable worksheets include one page on quadrants 1-4 and the digital worksheets include thr
Grades:
5th - 7th
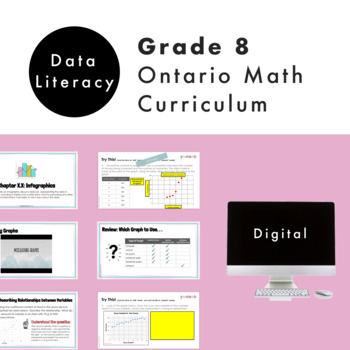
Grade 8 Ontario Math - Data Literacy Curriculum -Digital Google Slides+Form
Do you need a practical and engaging resource for the NEW Ontario Math Data strand? Are you planning for the NEW Grade 8 Ontario Math Curriculum? This editable Google Slide resource is what you need! This resource is for the Grade 8 DATA strand and covers specific expectations for “D1 Data Literacy." In this resource, students will experience math through engaging real-life questions, storytelling through math, and interactive slides. What’s Included5 Google Slide presentations132 UNIQUE and E
Subjects:
Grades:
7th - 9th
Types:
Also included in: Grade 8 NEW Ontario Math Curriculum Full Year Digital Slides Bundle
Showing 1-24 of 1,580 results


