7 results
5th grade statistics teacher manuals
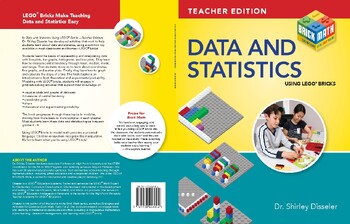
Data and Statistics: Teacher Edition
In Data and Statistics Using LEGO® Bricks—Teacher Edition, Dr. Shirley Disseler has developed activities that work to help students learn about data and statistics, using a common toy available in most classrooms and homes—LEGO® bricks! Students learn the basics of representing and interpreting data with line plots, bar graphs, histograms, and box plots. They learn how to measure central tendency through mean, median, mode, and range. Then students move on to learn about coordinates, line graphs
Subjects:
Grades:
5th - 8th
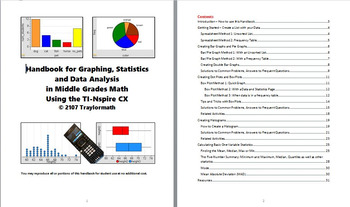
Graphing, Statistics & Data Analysis in Middle Grades Using TI-Nspire
This 30-page handbook ties together everything you need to use TI-Spire technology to teach middle school level data graphing and statistics. It will show you, step-by-step, how to create bar graphs, pie graphs, dot plot, box plots and histograms, and several methods for finding mean and quartiles, as well as an easy way to calculate Mean Absolute Deviation (MAD) with TI-Nspire. It also answers all those student questions about "why doesn't my graph look right?" Developed though several years of
Subjects:
Grades:
5th - 9th, Staff
Beginning Teachers Kit - Weeks 1 and 2
This Kit is a booklet filled with ideas and activities that you can do with your class in the first two weeks of school. It has instructions as well as planning sheets to go with the instructions. I also have resources for daily five, subject labels and duty labels. All of these visuals will help you in your first two weeks. This kit can also be used if you have never taught a certain age group before...enjjoy.
Subjects:
Grades:
4th - 8th
Australian Curriculum Mathematics: Statistics and Probability.
Statistics and probability is one of the strands of the Australian Curriculum Mathematics that could easily be presented as a stand-alone strand or just as easily incorporated into many other curriculum areas.
The proficiency strands of understanding, fluency, problem solving and reasoning are supported well in this learning strand. When related to students' experiences, understanding chance situations in their lives leads to fluency, problem-solving and reasoning skills. Data representation an
Subjects:
Grades:
PreK - 7th
Wilkie Way Pocket Guide To Further Developing Statistical Thinking
A guide to the essentials for further developing statistical thinking. Dealing with numeric data displays and multi variate data.
The statistics for students in the upper primary and lower secondary years.
Download onto your phone or tablet and have a quick guide at your fingertips.
Subjects:
Grades:
4th - 7th
The Basics of Data Analysis
This teacher guide will assist the teacher and your students with the basics of plots and graphs related to data analysis. Measures of center will also be discussed. Everywhere one looks we see numbers and data. From our height and weight measurements at the doctor’s office to weighing bananas at the produce department scale, we are constantly bombarded with numbers. Trying to find a meaning from this information can become a monumental task. A branch of mathematics called “statistics” tries
Grades:
4th - 12th, Higher Education, Adult Education
Types:

Common Core Standards for Measurement and Data for K-5
The Common Core Standards for Measurement and Data for K-5 are listed.
Subjects:
Grades:
K - 5th
Showing 1-7 of 7 results


