17 results
Common Core HSS-ID.B.6 resources for Easel
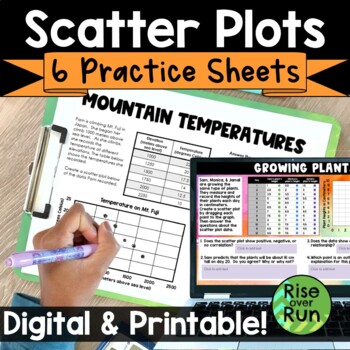
Scatter Plots & Line of Best Fit Practice Worksheets
Practice using scatterplots with these six activities. They can be used as bell ringers, exit tickets, homework, or just general practice. Students graph points, interpret data, and look for types of correlation with these practice sheets. All practice sheets are included as printable PDFs and interactive Google Slides. 6 scatter plot activities are included:Test Grades Scatter Plot PracticeMountain Temperatures Scatter Plot PracticeGrowing Plants Scatter Plot PracticeHair Length Data Collectio
Grades:
8th - 9th
Types:
CCSS:
Also included in: 8th Grade Math Activities & Lessons Bundle for the Whole Year
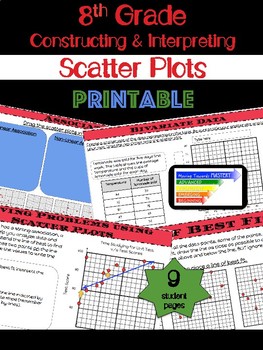
8th Grade Math Constructing & Interpreting Scatter Plots
Extensive printable lessons for constructing and interpreting scatter plots.The lessons are scaffolded to build understanding. Students will progress from identification of terms to making predictions involving bivariate data. The guided lessons will begin with identification, move towards assisted analysis, and conclude with independent practice.Lessons include...♦ Definitions and Visual Representations♦ Identification and Use of Terms → Bivariate Data → Scatter Plot → Linear, Nonli
Subjects:
Grades:
8th - 10th
Types:
CCSS:
Also included in: 8th Grade Math Common Core Growing Bundle
![Preview of Statistics Final Exam and Review [AP, College, and Honors]](https://ecdn.teacherspayteachers.com/thumbitem/Statisticis-FinalReviewStudy-Guide-Exam-1711356723/original-699492-1.jpg)
Statistics Final Exam and Review [AP, College, and Honors]
You can use this Statistics Final Exam in an AP Statistics, Honors Statistics, or a College Statistics course as an assessment, review or both. What's Included?Included are 6 different versions, each including 60 well chosen representative questions in both multiple choice format and also in free response format*. These reviews and tests work well in class or as a take- home. The tests are editable with Adobe Acrobat Pro. Each test should take about 2 - 3 hours and can be taken with a graphin
Subjects:
Grades:
10th - 12th, Higher Education
Types:
CCSS:
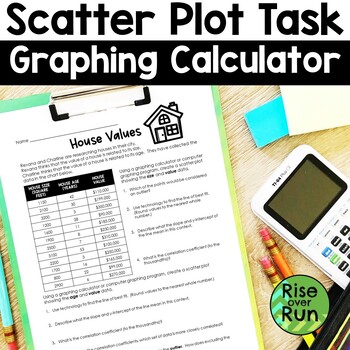
Scatter Plot Worksheet with Graphing Calculator Practice
Need a real world scatter plot activity where students use their graphing calculators? Grab this activity and help your students understand lines of best fit and calculating correlation coefficients!Students are given data on house sizes, house ages, and house values. They use a graphing calculator or computer program to plot the points and answer questions that follow.This is a great activity for partners to explore or for individual work. It can lead to some great math discussions!Answer key
Subjects:
Grades:
8th - 9th
Types:
CCSS:
Also included in: Algebra 1 and 8th Grade Math Curriculum Bundle for Entire Year
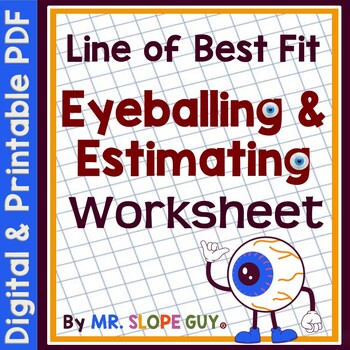
Line of Best Fit Practice Worksheet
Hello Math Teachers! Are you looking for a fun and engaging way for your students to practice their scatterplot skills? Check out this worksheet that focuses on eyeballing the line of best fit and estimating the correct equation that corresponds with it.With this two-sided worksheet, students will have the opportunity to practice using scatterplots and make the connection to the fit of a linear function. The scaffolding includes matching equations to the line of best fit (regression line), which
Subjects:
Grades:
8th
Types:
CCSS:
Also included in: Scatterplots Two Way Tables and Residual Plots Worksheets Bundle
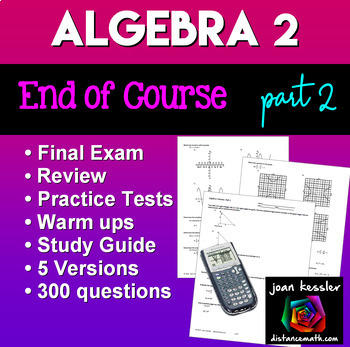
Algebra 2 Final Exam or Review Packet Part 2
This Algebra 2 - Part 2 Review can be used as a Final Exam, or Warm Ups and includes 300 Questions in 5 Versions. It can also be used as a Pretest or review for many topics in PreCalculus. Since Algebra 2 Curriculum differs between schools, I have created this to supplement Algebra 2 End of Course Reviews with 250 Questions Part 1 with topics found in many Algebra 2 curricula, especially those that are Common Core or similar.TOPICS INCLUDE • Conics: Circles, Ellipses, Hyperbolas, Parabolas
Subjects:
Grades:
9th - 12th
Types:
CCSS:
Also included in: Algebra 2 EOC Review or Exam Bundle
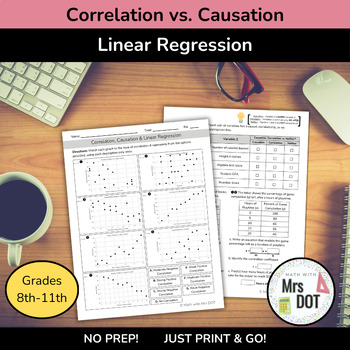
Correlation, Causation, & Linear Regression | Algebra Activity
Embark on a mathematical adventure with "Correlation, Causation, & Linear Regression." This captivating educational experience brings algebra to life for students by linking classroom concepts with the real world. It’s an activity designed to spark curiosity and demonstrate the power of numbers in everyday contexts.Key Features:Real-World Relevance: Engages students with scenarios they can relate to, from sports statistics to social media trends, making abstract concepts tangible.Critical Th
Subjects:
Grades:
8th - 11th
Types:
CCSS:
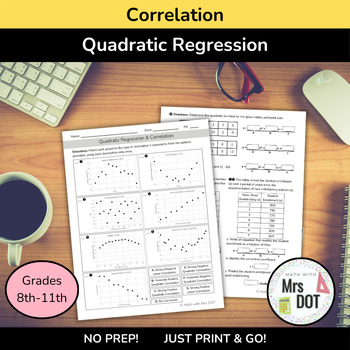
Quadratic Regression & Correlation | Algebra Activity
Explore the engaging world of "Quadratic Regression & Correlation," designed to unravel the complexities of quadratic relationships and correlations within the familiar setting of high school.Key Features:Engaging Contexts: Utilize real-life scenarios to illuminate the practical applications of quadratic regression, making abstract concepts relatable and understandable.Interactive Learning: Through calculating quadratic regression equations and analyzing data sets, students actively engage w
Subjects:
Grades:
8th - 11th
Types:
CCSS:
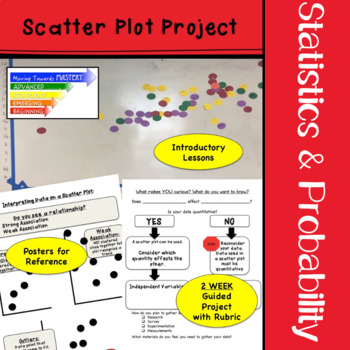
Scatter Plot Project End of Year Math Activity with Real World Data
TWO Week guided project for constructing and interpreting scatter plots. This engaging scatter plot project is individualized to allow students to research areas of interest. This project is great for a math end of year activity but it can also be used year round! Students will gather data on their topic of choice and use the project plan to organize their data into a scatter plot. Students will then analyze the results of the data collected.Six posters to guide students as they work independent
Subjects:
Grades:
8th - 10th, Higher Education
Types:
CCSS:
Also included in: Middle School Math Projects for End of the Year Activities
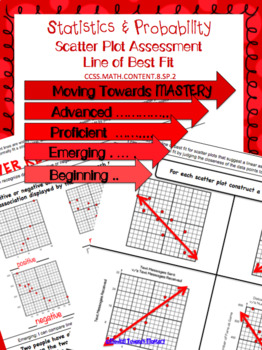
8.SP.2 Scatter Plots: Line of Best Fit Assessment
Assessment for Scatter Plots: Line of Best Fit that measures understanding at various levels of mastery to identify at what level students have progressed. Levels of mastery are:→ Beginning → Emerging→ Proficient→ AdvancedEASY printing with answer key--------------------------------------------------------------------------------------------------------------------------------------------------------------These printable worksheets can also be used as digital resources through the TpT Digital Ac
Subjects:
Grades:
8th - 10th
Types:
CCSS:
Also included in: 8th Grade Common Core Statistics & Probability Assessments
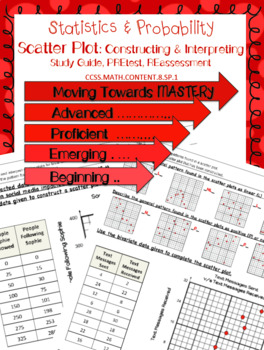
8.SP.1 Construct & Interpret Scatter Plots Pre-test/ Study Guide/ Reassessment
This resource would be useful in the following ways:→ Pre-test before introducing the standard→ Study Guide to prepare for the assessment→ Reassessment This resource will allow you to measure student understanding of how to construct and interpret a scatter plot at various levels of mastery to identify at what level students are prior to instruction or after instruction. Levels of mastery are:→ Beginning → Emerging→ Proficient→ AdvancedEASY printing with answer key-------------------------------
Subjects:
Grades:
8th - 10th
CCSS:
Also included in: 8th Grade Common Core Statistics & Probability Assessments
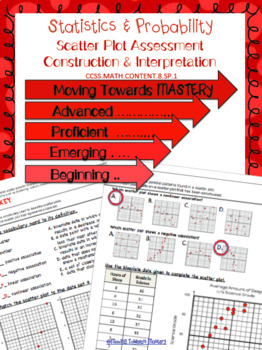
8.SP.1 Scatter Plots: Construction & Interpretation Assessment
Assessment for Scatter Plots: Construction & Interpretation that measures understanding at various levels of mastery to identify at what level students have progressed. Levels of mastery are:→ Beginning → Emerging→ Proficient→ AdvancedEASY printing with answer key--------------------------------------------------------------------------------------------------------------------------------------------------------------These printable worksheets can also be used as digital resources through t
Subjects:
Grades:
8th, Higher Education
Types:
CCSS:
Also included in: 8th Grade Common Core Statistics & Probability Assessments
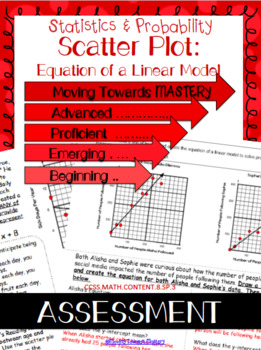
8.SP.3 Scatter Plots: Equation of a Linear Model Assessment
Assessment for Scatter Plots: Equation of a Linear Model that measures understanding at various levels of mastery to identify at what level students have progressed. Levels of mastery are:→ Beginning → Emerging→ Proficient→ AdvancedEASY printing with answer key--------------------------------------------------------------------------------------------------------------------------------------------------------------These printable worksheets can also be used as digital resources through the TpT
Subjects:
Grades:
8th - 10th
Types:
CCSS:
Also included in: 8th Grade Common Core Statistics & Probability Assessments
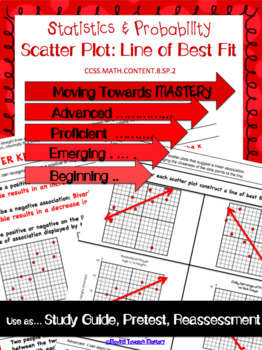
8.SP.2 Scatter Plots: Line of Best Fit Pre-test/ Study Guide/ Reassessment
This resource would be useful in the following ways:→ Pre-test before introducing the standard→ Study Guide to prepare for the assessment→ Reassessment This resource will allow you to measure student understanding of how to construct a line of best fit on a scatter plot at various levels of mastery to identify at what level students are prior to instruction or after instruction. Levels of mastery are:→ Beginning → Emerging→ Proficient→ AdvancedEASY printing with answer key-----------------------
Subjects:
Grades:
8th - 10th
CCSS:
Also included in: 8th Grade Common Core Statistics & Probability Assessments
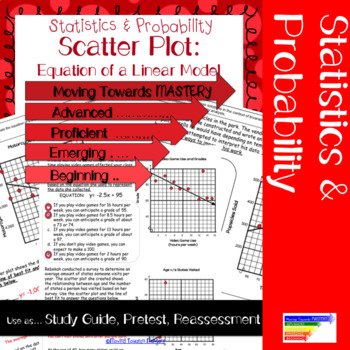
8.SP.3 Scatter Plots: Equation of a Linear Model: Pretest/ Study Guide/ Reassess
This resource would be useful in the following ways:→ Pre-test before introducing the standard→ Study Guide to prepare for the assessment→ Reassessment This resource will allow you to measure student understanding of equations of linear models at various levels of mastery to identify at what level students are prior to instruction or after instruction. Levels of mastery are:→ Beginning → Emerging→ Proficient→ AdvancedEASY printing with answer key--------------------------------------------------
Subjects:
Grades:
8th - 10th
Types:
CCSS:
Also included in: 8th Grade Common Core Statistics & Probability Assessments
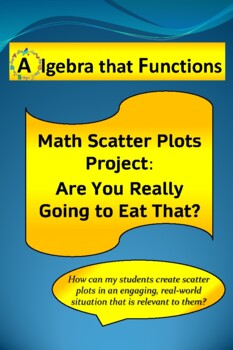
Math Project Scatter Plots: Are You Really Going to Eat That? *DISTANCE LEARNING
PRINT and DIGITAL * * Makes distance planning so much easier!Math Project Scatter Plots: Are You Really Going to Eat That? This math project is a fun way for your students to use bivariate data that is highly engaging and relevant to them to construct scatter plots in a real-world situation! Your students will enjoy making choices about restaurants and meals they like to eat based on their personal needs and wishes. Students will organize the nutrition data of the meals they choose using tables
Subjects:
Grades:
7th - 10th, Adult Education
CCSS:
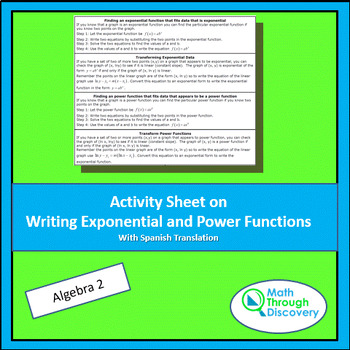
Alg 2 - Writing Exponential and Power Functions Activity Sheet
This activity sheet, containing twelve exercises, engages the students in writing equations that model exponential and power functions. Students write equations for exponential that pass through two points by working with simultaneous equations and the general equation y = abx.Students write equations for power functions that pass through two points by working with simultaneous equations and the general equation y = axb .Students write equations for exponential functions that pass through sever
Subjects:
Grades:
9th - 11th
Types:
CCSS:
Also included in: Alg 2 - Exponential & Logarithmic Functions Activity Sheets - Bundle 4
Showing 1-17 of 17 results

