120 results
Common Core HSS-ID.B.6 resources for Google Apps
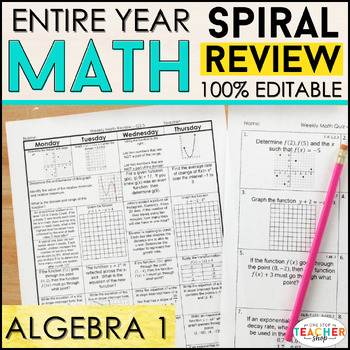
Algebra 1 Spiral Review | Homework, Algebra 1 Warm Ups, Progress Monitoring
This Algebra 1 spiral review & quiz resource can easily be used as HOMEWORK, WARM-UPS, or a DAILY MATH REVIEW! This resource was designed to keep math concepts fresh all year and to help you easily track student progress. All pages are 100% EDITABLE and easy to differentiate to fit your students' needs.⭐⭐UPGRADE for just $10 and get both PRINT & DIGITAL versions } CLICK HERE✪ CLICK HERE to see more SUBJECTS & GRADE LEVELS!★★SAVE $$ with these BUNDLES★★Algebra 1 Bundle: Spiral Review,
Subjects:
Grades:
8th - 10th
Types:
CCSS:
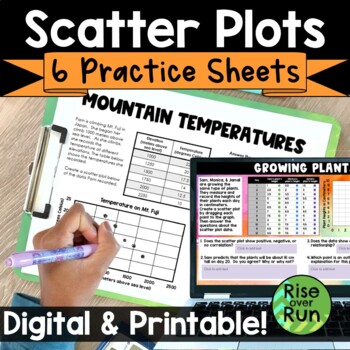
Scatter Plots & Line of Best Fit Practice Worksheets
Practice using scatterplots with these six activities. They can be used as bell ringers, exit tickets, homework, or just general practice. Students graph points, interpret data, and look for types of correlation with these practice sheets. All practice sheets are included as printable PDFs and interactive Google Slides. 6 scatter plot activities are included:Test Grades Scatter Plot PracticeMountain Temperatures Scatter Plot PracticeGrowing Plants Scatter Plot PracticeHair Length Data Collectio
Grades:
8th - 9th
Types:
CCSS:
Also included in: 8th Grade Math Activities & Lessons Bundle for the Whole Year
Correlation All-Star -- Sports Data Analysis - 21st Century Math Project
Bring an authentic sports-based math project to your Algebra, Algebra 2 or PreCalculus classroom with Lines of Best Fit and Correlations! All in this 21st Century Math Project! Using data from the MLB, NBA, NFL and NHL students investigate correlations to some of sports most common questions like: "Do more shots result in more goals?" "Do hitters or pitchers have more impact on a team's wins?""What NFL stat is most strongly correlated with wins?" and the grand-daddy..."Can money buy championship
Subjects:
Grades:
7th - 12th
Types:
CCSS:
Urban Sprawl -- Polynomial Modeling - 21st Century Math Project
This 21st Century Math Project is an opportunity to bring polynomial functions into the real world. Along using polynomial functions and developing regressions skills, students will engage in thoughtful city planning from the perspective of a member of the City Commission for Urban Planning.In this 10 page document you will be given a mapping to the Content Standards, an outline for how to implement the unit and two main assignments. ***THIS PRODUCT HAS BEEN UPDATED WITH A GOOGLE SLIDES INTERACT
Subjects:
Grades:
8th - 12th
Types:
CCSS:
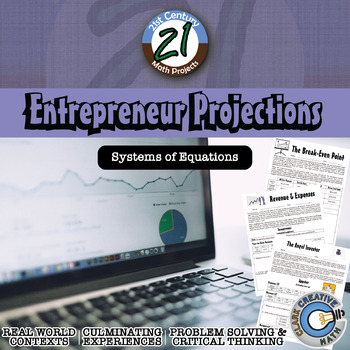
Entrepreneur Projections - Financial Literacy & Systems - Math Project
Student put on their entrepreneur and investor hat to make expense and revenue projections for a business in this 21st Century Math Project. Students will work through a variety of entrepreneurial dilemmas and help small business owner make decisions relative to their break even point. In the final project, students will play the role of an Angel Investor, use regression to project revenue and expenses and analyze a financial forecast. Download the preview to see everything included! ***THIS PRO
Subjects:
Grades:
7th - 12th
Types:
CCSS:
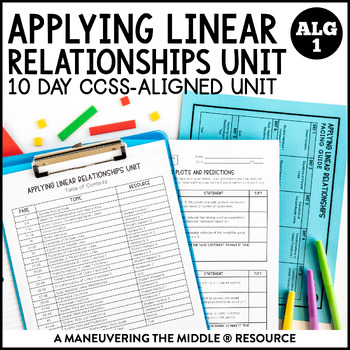
Applying Linear Relationships Unit | Parallel & Perpendicular Lines | Algebra 1
A 10-day Applying Linear Relationships CCSS-Aligned complete unit including concepts of applying linear relationships. Students will solve problems involving direct variation, write equations of parallel and perpendicular lines, describe transformations of linear functions, calculate the correlation coefficient of linear scatter plots and write equations for lines of best fit on a scatter plot.Students will practice with both skill-based problems, real-world application questions, and error anal
Subjects:
Grades:
8th - 9th
Types:
CCSS:
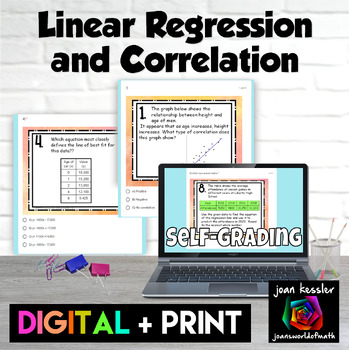
Linear Regression and Correlation Digital plus Print with TI-84 notes
This Linear Regression and Correlation activity is a great way for your students to practice their skills. There are 12 well chosen representative problems. Digital and printable PDF versions included. Questions include:CorrelationLine of Best FitProjecting TrendsFind the linear regression from a tableFind the linear regression from a scatter plotDetermining the correlation coefficientThe editable digital self checking version can be used as an Quiz, HW, or Paperless worksheet and is designed
Subjects:
Grades:
8th - 10th
Types:
CCSS:
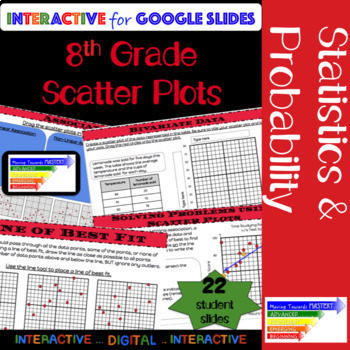
8th Grade Math Scatter Plot: Guided Interactive Lesson
Extensive ALL digital guided lesson for constructing and interpreting scatter plots.The slides are scaffolded to build understanding. Students will progress from identification of terms to making predictions involving bivariate data. The guided slides will begin with identification, move towards assisted analysis, and conclude with independent practice.Slides include...♦ Definitions and Visual Representations♦ Identification and Use of Terms→ Bivariate Data→ Scatter Plot→ Linear, Nonlinear, &
Subjects:
Grades:
8th - 10th
Types:
CCSS:
Also included in: 8th Grade Math Common Core Growing Bundle
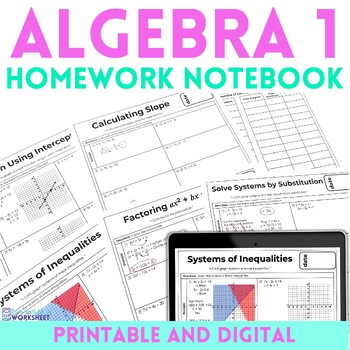
Algebra 1 Homework | Printable Homework Worksheets
⭐⭐ This Algebra 1 homework resource provides you with ready-to-go homework assignments for the school year! Included are 80 individual pages of homework. The assignments are available in both printable and digital (Google Slides) formats.✅ Skills sets covered:Rational Number Operations ReviewExpressions ReviewSolving Equations Functional and Linear RelationshipsInequalitiesLinear Systems Exponential FunctionsSimplifying and Factoring PolynomialsQuadratic Functions and Equations✅ The zip file inc
Grades:
8th - 9th
Types:
Also included in: Algebra 1 Curriculum: Comprehensive, Engaging & Standards-Aligned
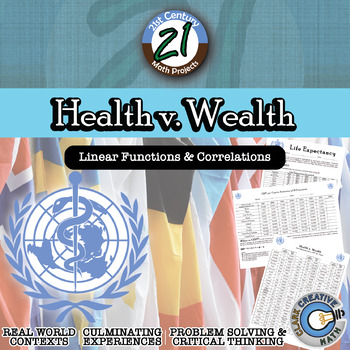
Health v. Wealth -- International Data & Correlation - 21st Century Math Project
Correlations and causation should be abundantly clear when students examine data of the Health and Wealth of over 80 nations around the world. The world is ever-changing and it is important for students to have a basic level of global awareness. In this 21st Century Math Project, students will use real world data to model regression functions, examine correlations and predict the future. In this project students will investigate global data sets to examine potential correlations related with the
Subjects:
Grades:
7th - 12th
Types:
CCSS:
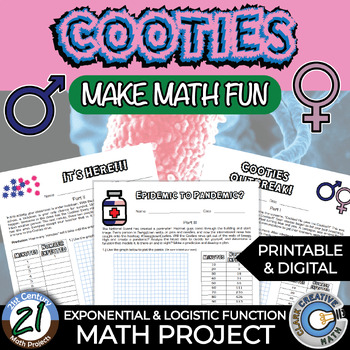
Cooties -- Pandemics -- Exponential & Logistic - 21st Century Math Project
It was an ordinary day. It was. Then came the screams, “Cooties! He gave me Cooties!!!” This was soon followed by “Cooties! She gave me Cooties!!!” Soon classes began to fall over (still breathing), but in an unconscious state. Bodies started turning blue and pink. A contagion was among them. The teachers, who have to receive Cooties immunizations to get their licensure, were left stunned.Turn your Algebra 2 or Pre-Calculus into a contagion command center with this 21st Century Math Project. Spe
Subjects:
Grades:
8th - 12th
Types:
CCSS:
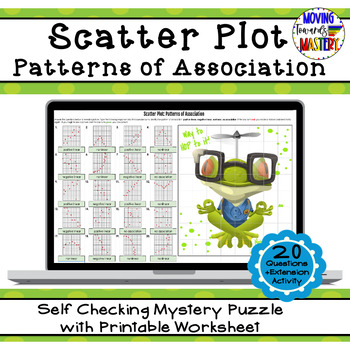
Scatter Plot: Patterns of Association Self Checking Mystery Picture
Engaging math self checking review activity to practice identifying patterns of association for scatter plots.This self-checking activity will allow students to practice identifying patterns of association for scatter plots. Students will use their understanding of scatter plots to answer questions to reveal pieces of a mystery puzzle as they work, just like a pixel art activity! If students answer incorrectly, the box will turn red and NO picture pieces will be revealed. This resource include
Subjects:
Grades:
7th - 10th
Types:
CCSS:
Also included in: 8th Grade Math Common Core Growing Bundle
Gridiron Glory -- "Big Game" Data & Paper Football - 21st Century Math Project
I have heard that Americans like Football. I have also heard about an important game that happens in February. I have heard that it's a day that nachos dread. In this 21st Century Math Project, students will complete a variety Football-based assignments related to the Statistics strands of the Common Core. The project caps off with a Paper Football tournament that asks students to use expected value to guide their decisions!This product includes 3 prep assignments that reaches a variety of learn
Subjects:
Grades:
6th - 12th
Types:
CCSS:
Also included in: Probability & Expected Value Unit Bundle - Distance Learning Compatible
Internet Usage -- Intl Polynomial Regression - 21st Century Math Project
Experts believe that in the next twenty years the internet will be as integrated into our life as electricity. Today, the internet holds more information than you could read in 1,000 lifetimes. Today, there are 644 million active websites and that number is growing each day. In the United States, we may take for granted how easy it is to get on the internet. In different parts of the world this isn’t the case. Bring Internet Usage Statistics into your Algebra 2 / PreCalculus classroom with polyn
Subjects:
Grades:
8th - 12th
Types:
CCSS:
Scatter Plots Google Forms Homework
This 24-question, auto-grading Google Forms assignment provides students with practice analyzing & interpreting scatter plots. The following types of questions are included:Types of Correlation (positive/ negative/ no/ weak/ strong)Identifying Linear, Exponential, or QuadraticWriting a Line of Best FitInterpreting a Scatter Plot on Real- World DataQuestions are "drop-down", "multiple choice", and "select all that apply".This download also includes a PDF "worksheet" with the exact same quest
Subjects:
Grades:
7th - 10th
Types:
CCSS:
Also included in: Algebra 1 Google Forms Semester 2 Digital and Printable Homework Bundle
U.S. President -- Data Analysis & Statistics Inquiry - 21st Century Math Project
Engage students in data analysis through use of Presidential data in this 21st Century Math Project. Students will create box and whisker, stem and leaf, histograms and scatterplot through their investigations. In the end, students will take on the inquiry question: "Do US Presidents with the most children live longer after they have been inaugurated?" ***THIS PRODUCT HAS BEEN UPDATED WITH A GOOGLE SLIDES INTERACTIVE VERSION INCLUDED. REDOWNLOAD IF YOU HAVE IT ALREADY***-- In "He Entered a Youn
Subjects:
Grades:
6th - 12th
Types:
Measures of Center & Variance Unit Bundle - Distance Learning Compatible
This is a selection of my Measures of Center & Variance resources all in a money saving Essential Bundle! You save significant money and time versus purchasing these separately!Essential Bundles are designed to give you everything you need to rock your unit. Warmups, Notes, Activities, Games, Exit Tickets, and Tests. You will find a selection of my Drive Instruction, Escapes, Boot Camp, Adventures, Whodunnits, CSI, Person Puzzles, STEM-ersions, Herowork, TableTop and my 21st Century Math Pro
Subjects:
Grades:
6th - 12th
Types:
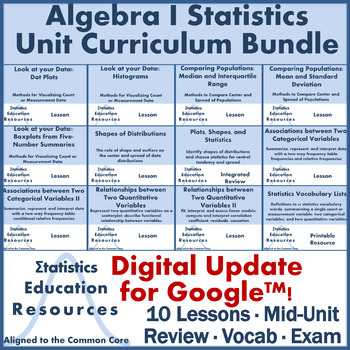
Bundle: Algebra 1 Statistics Unit Curriculum (Common Core)
UPDATE: Now includes lesson slides and editable worksheets for Google™ Slides and unit exam in Google™ Forms!Algebra I Statistics Unit BundleThis product is a bundle that includes 10 Common Core Aligned lessons, 4 statistics vocabulary lists (1 master list for the whole unit, and 3 smaller unit “sub lists”), 1 mid-unit integrated mini-review and worksheet (as homework or a quiz!), and 1 exam with answer key. Each lesson includes lecture slides with speaker notes, a handout, worksheet with answer
Subjects:
Grades:
8th - 11th
Types:
CCSS:

Algebra 1 - ENTIRE YEAR - Exit Tickets for Google Forms™
About This Resource:This is a bundle of all 88 of my Google Forms Exit Tickets that relate to Algebra 1 content and their standards. The instructions for each exit ticket are easy to follow for you to make a copy of the Google Form into your Google Drive. Then you can assign to your students using Google Classroom or some other method.What's Included:Above you can preview each of the exit tickets to see what you will receive. I am continually adding more exit tickets to the collection. You will
Subjects:
Grades:
9th - 11th
Types:
CCSS:
Google Forms™ Quiz - Scatter Plots - 8.SP.1-3 - Distance Learning
About This Resource:This is a Google Forms Quiz on scatter plots. The instructions are easy to follow for you to make a copy of the quiz to your Google Drive. Then you can assign to your students using Google Classroom or some other method.Questions on this assessment were carefully created to give our students the best practice on the following standard.8.SP.1 - Construct and interpret scatter plots for bivariate measurement data to investigate patterns of association between two quantities. De
Subjects:
Grades:
8th - 12th
Types:
CCSS:
High School SBAC Assessment Practice Test - (Google Forms™ and Paper Included)
About This Resource:We all have the pressure of our students performing well on the SBAC. It can be a very intimidating test! I have spent countless hours researching the SBAC summative assessment blueprint and creating items that meet the rigor of the item specifications. Your students will be fully prepared for the test with this resource!What's Included:Claim 1 Practice Test already set up in Google Forms with auto gradingClaim 1 Practice Test in Paper formatClaim 1 Answer Key in PDF formatCl
Subjects:
Grades:
9th - 12th
Types:
CCSS:
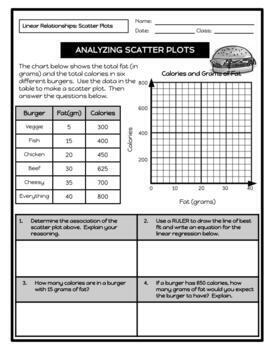
Linear Relationships (Regression): 30+ Scatter Plot Worksheets
Practice using scatter plots with 30+ activities covering the following topics:Quantitative versus Qualitative DataUnivariate Data versus Bivariate DataCausation versus Non-CausationReading a Scatter PlotDetermining Line of Best FitConstructing Scatter PlotsAnalyzing Scatter PlotsDetermining Correlation CoefficientCreating Residual PlotsIndependent InvestigationThese activities can be used as general practice, bell ringers, exit tickets, homework, and/or benchmarks. Students are required to gra
Subjects:
Grades:
8th - 12th
Types:
CCSS:

Scatterplots and Trend Lines Notes 8th Algebra 1
This set of Scatterplots and Trend Lines notes comes with a VIDEO LESSON and an explore section so your students can engage with the new concept before they learn it! With digital and printable versions, you'll have everything you need to teach scatterplots & trend lines!Each set of notes includes an Explore section for students to explore the topic before direct instruction, direct instruction in the Explain section, independent practice in the Execute section, and a challenge problem in an
Grades:
8th - 9th
Types:
CCSS:
Constructing Scatter Plots Digital Notes & 2 Quizzes (GOOGLE) (Distance Learning
Product DescriptionGoogle Slides Digital Interactive Notes. The notes are everything beneficial of an interactive notebook without all the paper, glue, scissors, etc.Content:Students will be able to construct scatter plots given a set of data. Students will be able to identify positive correlation, negative correlation, and no correlation. Includes:Google Slides: Constructing Scatter Plots Digital NotesGoogle Forms: Self Grading Quick Check Quiz 1 & Self Grading Quick Check Quiz 2Answer KeyT
Subjects:
Grades:
6th - 9th
Types:
CCSS:
Also included in: 8th Grade Math Digital Notes GROWING BUNDLE (Distance Learning)
Showing 1-24 of 120 results

