243 results
Common Core HSS-ID.B.6 pdfs
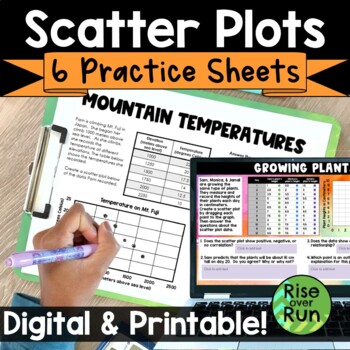
Scatter Plots & Line of Best Fit Practice Worksheets
Practice using scatterplots with these six activities. They can be used as bell ringers, exit tickets, homework, or just general practice. Students graph points, interpret data, and look for types of correlation with these practice sheets. All practice sheets are included as printable PDFs and interactive Google Slides. 6 scatter plot activities are included:Test Grades Scatter Plot PracticeMountain Temperatures Scatter Plot PracticeGrowing Plants Scatter Plot PracticeHair Length Data Collectio
Grades:
8th - 9th
Types:
CCSS:
Also included in: 8th Grade Math Activities & Lessons Bundle for the Whole Year
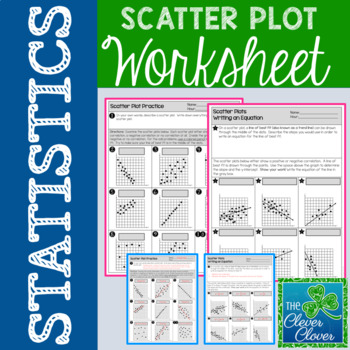
Scatter Plot Worksheet
Scatter Plot Worksheet
This resource allows students to explore scatterplots with a two page worksheet. Students are asked to define scatterplots in their own words. Nine questions ask students to identify the type of correlation (positive, negative or no correlation) that exists between two variables. Students are also asked to describe the steps used to write an equation for the line of best fit. Six additional questions require students to calculate the slope and determine the y-intercept
Subjects:
Grades:
6th - 9th, Adult Education
Types:
CCSS:
Also included in: Scatter Plot Mini-Bundle
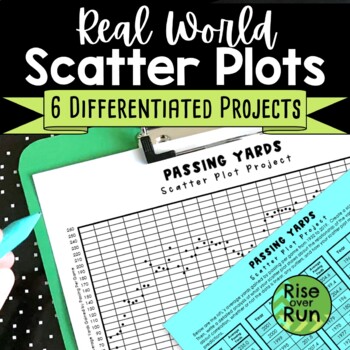
Scatter Plot Project with Real World Sports Data
Practice creating and analyzing scatter plots with these six differentiated real world projects. Students are provided statistics for a sport and must graph the data. Then, they write an analysis describing correlation, whether or not the data is linear, any outliers, and how the scatter plot might be used to make predictions. The scatterplots range from 38 points to 149 points, so they can be used to differentiate. The scatter plots will take a little time to plot, but they result in real
Subjects:
Grades:
8th - 9th
Types:
CCSS:
Also included in: 8th Grade Math Activities & Lessons Bundle for the Whole Year
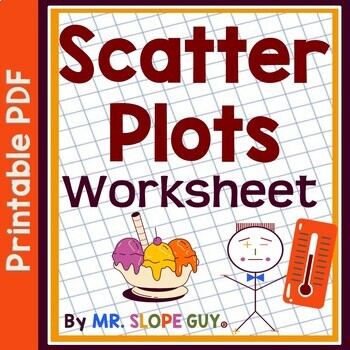
Scatter Plots Statistics Worksheet 8.SP.A.1
Hello, Amazing Educators! Ready to transform scatter plots from a math challenge to a thrilling adventure? Our Interactive Scatter Plot Worksheet is here to make learning a breeze and turn your classroom into a hub of critical thinking and problem-solving excitement! Why Choose Our Interactive Worksheet? Engaging and Interactive: Say goodbye to dull lessons! This two-sided worksheet is packed with interactive elements that keep students hooked. From constructing and interpreting scatter plots to
Subjects:
Grades:
8th
Types:
CCSS:
Also included in: Scatterplots Two Way Tables and Residual Plots Worksheets Bundle
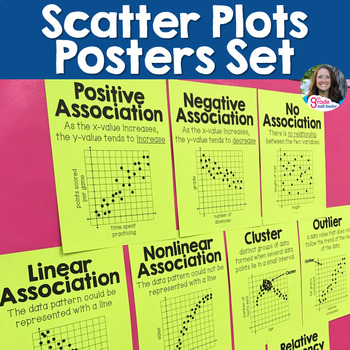
Scatter Plots and Two Way Tables Posters Set for 8th Grade Math Word Wall
Make the vocabulary visible and accessible for your students! This set of 12 printable vocabulary posters provides visuals and reminders for your students to reference during your Bivariate Data unit. Display these on your word wall while teaching scatter plots and two-way tables!The following vocabulary terms are included:scatter plotpositive association or positive correlationnegative association or negative correlationno association or no correlationlinear associationnonlinear associationoutl
Subjects:
Grades:
8th - 9th
Types:
CCSS:
Also included in: 8th Grade Math Vocabulary Posters for Word Wall - Full Year
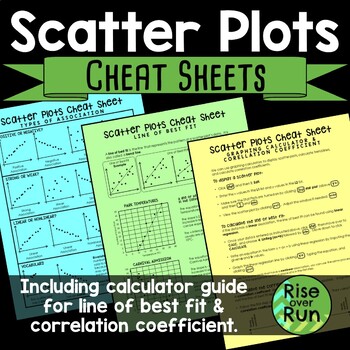
Scatter Plot Cheat Sheets Printable Guided Notes
Detailed sheets for the following topics: •Types of Association & VocabularyThis page shows examples of positive, negative, strong, weak, linear, and nonlinear association. It also shows clusters and outliers.•Line of Best FitThis page explains what a line of best is (or trend line) along with examples and nonexamples. It has 2 real world connections and how to interpret the line of best fit.•Graphing Calculator Guide & Correlation CoefficientThis sheet gives step by step instructions fo
Subjects:
Grades:
8th - 9th
CCSS:
Also included in: 8th Grade Math Activities & Lessons Bundle for the Whole Year
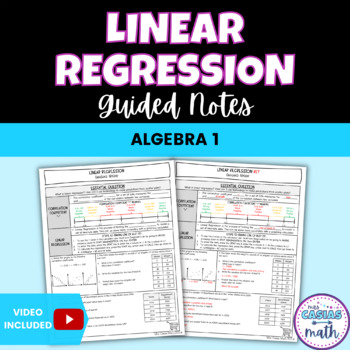
Linear Regression and Correlation Coefficient Guided Notes Lesson Algebra 1
This concise, to the point and no-prep linear regression lesson is a great way to teach & introduce how find the correlation coefficient and line of best fit with technology to your students. These notes go over the steps to using linear regression on a TI-84 calculator and include 3 in-depth examples with multiple parts where students find & interpret the correlation coefficient & line of best fit. Students and teachers love how easy these notes are to follow and understand. These n
Subjects:
Grades:
8th - 9th
CCSS:
Also included in: Linear Equations and Inequalities Algebra 1 Guided Notes Lessons BUNDLE
![Preview of Statistics Final Exam and Review [AP, College, and Honors]](https://ecdn.teacherspayteachers.com/thumbitem/Statisticis-FinalReviewStudy-Guide-Exam-1711356723/original-699492-1.jpg)
Statistics Final Exam and Review [AP, College, and Honors]
You can use this Statistics Final Exam in an AP Statistics, Honors Statistics, or a College Statistics course as an assessment, review or both. What's Included?Included are 6 different versions, each including 60 well chosen representative questions in both multiple choice format and also in free response format*. These reviews and tests work well in class or as a take- home. The tests are editable with Adobe Acrobat Pro. Each test should take about 2 - 3 hours and can be taken with a graphin
Subjects:
Grades:
10th - 12th, Higher Education
Types:
CCSS:
NC Math 1 Practice End-of-Course Test (North Carolina EOC Final Exam Review)
This full length 60-item multiple choice practice test is aligned to the North Carolina Standards for Math 1. It includes 16 non-calculator active questions and 44 calculator active questions. An answer key and item/standard alignment is included for easy data analysis.
Subjects:
Grades:
7th - 10th
Types:
CCSS:
Linear Regression and Correlation Digital plus Print with TI-84 notes
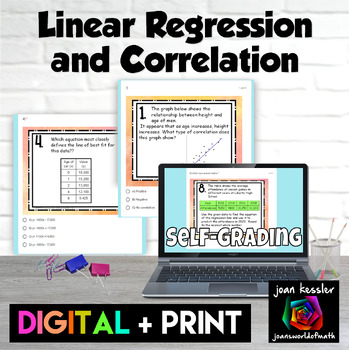
This Linear Regression and Correlation activity is a great way for your students to practice their skills. There are 12 well chosen representative problems. Digital and printable PDF versions included. Questions include:CorrelationLine of Best FitProjecting TrendsFind the linear regression from a tableFind the linear regression from a scatter plotDetermining the correlation coefficientThe editable digital self checking version can be used as an Quiz, HW, or Paperless worksheet and is designed
Subjects:
Grades:
8th - 10th
Types:
CCSS:
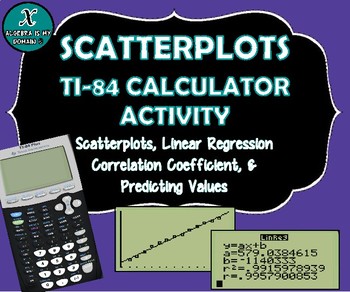
TI-84 CALCULATOR ACTIVITY - Data, Scatterplots, Regression & Line of Best Fit
This file includes four linear regression examples (all real-life data). The examples cover the following topics for the TI-84 graphing calculator:
* Creating a scatterplot
* Performing linear regression (finding the equation of the best-fit line)
* Interpreting the slope of the equation
* Calculating and interpreting the correlation coefficient
* Predicting values (using the linear regression equation)
The first example gives the step-by-step instructions to calculate all the necessary value
Subjects:
Grades:
7th - 12th, Higher Education
Types:
CCSS:
International Cell Phone Plan -- Linear Equations - 21st Century Math Project
As your students try to sneak cell phone usage into your lesson, make them consider the costs associated with international travel in this 21st Century Math Project!In this project, you will receive three separate assignments. In “Cell Phone Comparison” students will become familiar with writing linear equations from cell phone data and using the equations.In “International Pre Paid Plans” students will continue practicing writing and using linear equations. The data is from 11 different countri
Subjects:
Grades:
7th - 12th
Types:
CCSS:
Scatter Plots and Line of Best Fit Guided Notes Lesson Algebra 1
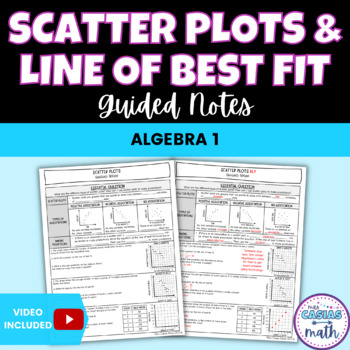
This concise, to the point and no-prep scatter plots lesson is a great way to teach & introduce how to write the line of best fit to your students. These notes go over types of associations from scatter plots, and how to make predictions from scatter plots by writing the equation for the line of best fit without technology. There are 3 in-depth examples with multiple parts where students practice writing the line of best fit with two points from the line and use it to predict. Students and t
Subjects:
Grades:
8th - 9th
Also included in: Linear Equations and Inequalities Algebra 1 Guided Notes Lessons BUNDLE
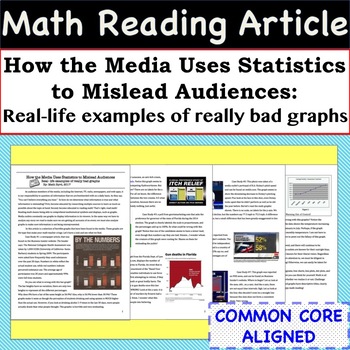
Statistics Math Article - Case Studies of Bad Graphs found in the Media
Incorporate Reading & Writing into the Math Classroom with this article and accompanying worksheet! The 4 page article is entitled - "How the Media Uses Statistics to Mislead Audiences: Real- life examples of really bad graphs". The worksheet helps students summarize the case studies and the article as a whole. This resource can be used in so many ways, some ideas are: station activity, independent reading assignment, small group activity, homework assignment, or whole class discussion.Skill
Subjects:
Grades:
8th - 11th
CCSS:
Also included in: Common Core Algebra 1 MATH READING ARTICLES - BUNDLE PRICE!
Mini Quizzes BUNDLE | Algebra 1 EOC Test Prep | STAAR New Item Types
Are you looking for Algebra 1 state test prep over the STAAR Redesign new item types? You will find it here with this Algebra 1 Mini Quizzes Bundle! This bundle includes 12 mini quizzes with four questions each - two questions over the new STAAR 2.0 question types and two multiple choice questions that are very similar to released STAAR questions.Here is a list of all that is included:Equations & Inequalities Mini-QuizFunctions and Domain & Range Mini-QuizLinear Relationships Mini-QuizLi
Subjects:
Grades:
8th - 9th
CCSS:
Linear Equations and Inequalities Algebra 1 Guided Notes Lessons BUNDLE
This bundle includes 16 different Algebra 1 lessons over linear equations and inequalities. These notes provide fantastic scaffolding by starting out with finding slope from linear equations in various forms, then move into point slope-form and standard form equations, parallel and perpendicular lines, linear inequalities, and end with scatter plots and linear regression. These lessons provide a variety of practice for students with simple skills-based problems all the way through real world app
Subjects:
Grades:
8th - 9th
CCSS:
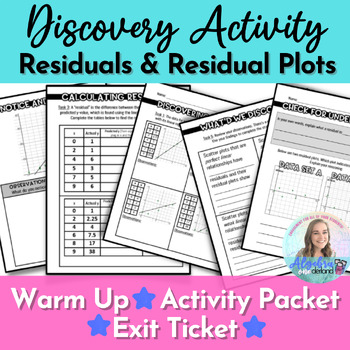
Residuals and Residual Plots Discovery Lesson Activity for Algebra 1
Make understanding residuals and residual plots east with this hands-on, discovery activity packet. Students will understand how residuals, regression and line of best fit connect and what the residuals tell us about the fit of the line. Included:A "Notice and Wonder" Task to start the lessonAn activity packet with three observation tasks related to line of best fit / linear regression, scatter plots, residuals and residual plots; culminating in a task that generalizes the concept of residuals a
Subjects:
Grades:
8th - 12th
Types:
CCSS:
Also included in: Algebra 1 Digital Activities for Google Slides Bundle #1!
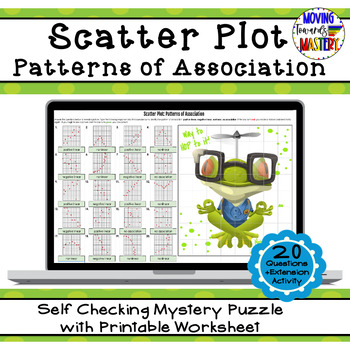
Scatter Plot: Patterns of Association Self Checking Mystery Picture
Engaging math self checking review activity to practice identifying patterns of association for scatter plots.This self-checking activity will allow students to practice identifying patterns of association for scatter plots. Students will use their understanding of scatter plots to answer questions to reveal pieces of a mystery puzzle as they work, just like a pixel art activity! If students answer incorrectly, the box will turn red and NO picture pieces will be revealed. This resource include
Subjects:
Grades:
7th - 10th
Types:
CCSS:
Also included in: 8th Grade Math Common Core Growing Bundle
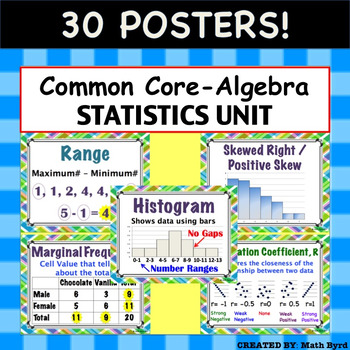
Common Core Algebra - Statistics Unit: Describing Data POSTERS
30 Posters! Each 8.5" x 11" in size. Posters are aligned with Common Core's Algebra - Statistics: Describing Data Unit. Posters Included:MeanMedianModeRangeInterquartile RangeOutlierMean Absolute DeviationMeasures of CenterMeasures of SpreadDot PlotHistogramBox PlotNormal/ Bell Shaped DistributionSkewed Right/Positive SkewSkewed Left/ Negative SkewUniform2 Way Frequency TableJoint FrequencyMarginal Frequency2 Way Relative Frequency TableConditional Relative FrequencyScatter PlotCorrelationCorrel
Subjects:
Grades:
8th - 11th
CCSS:
Also included in: Common Core Algebra 1 POSTERS - BUNDLE PRICE!

42 Blank Graph Templates: Horizontal & Vertical Bar Graph, Line Graph, Printable
Looking for an array of printable graph templates for all your future bar and line graph needs? Look no further! With 42 different templates ranging for bar graphs, to line graphs, varying in X values and Y values, this combination should be the last graph download you need to worry about for your class. These graphs can even be used as Histograms, Dot Plots, Scatter Plots, or a variety of other graphs to suit the needs of your classroom.I created this template to require all the basics of gr
Grades:
4th - 12th
Types:
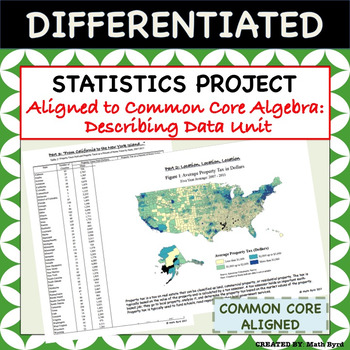
Statistics Project - Aligned to Common Core Algebra - Describing Data Unit
This differentiated U.S. Home Energy & Tax Themed Statistics Project covers all of the "describing data" standards of the Common Core Algebra Course using real data! Students will analyze various forms of tables & graphics to make inferences and interpret the data. The project is perfect for use as a summative assessment since students are required to justify their findings in open-ended format. Allow students to work in pairs, small groups, or individually! A grading rubric and selected
Subjects:
Grades:
8th - 11th
Types:
CCSS:
Also included in: Common Core Algebra 1 PROJECTS - BUNDLE PRICE!
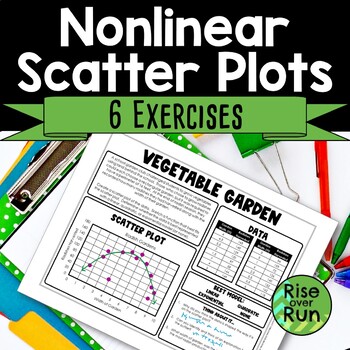
Nonlinear Scatter Plot Practice Activities
Explore non-linear scatter plots with these activity sheets! Included are 6 different sheets that each include a description of data collection, a table of data, a graph, and questions to encourage thinking. Students use the given data to create a scatter plot, determine if the relationship is linear, quadratic, exponential, or none of those. Then they sketch a line of best fit and answer questions. A blank template is included as well so students can create their own scatter plots. These works
Subjects:
Grades:
9th - 12th
Types:
CCSS:
Also included in: Algebra 1 and 8th Grade Math Curriculum Bundle for Entire Year
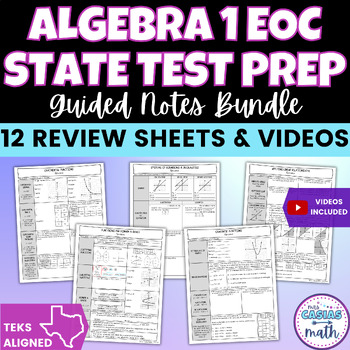
Algebra 1 STAAR EOC Review Sheets BUNDLE
Are you looking for Algebra 1 EOC Review Sheets? You will find it here with this STAAR Algebra 1 Review Guided Notes Bundle! This state test prep bundle includes 12 ready to go test prep lessons and videos over the following topics: Equations & Inequalities Review SheetFunctions and Domain & Range Review SheetLinear Relationships Review SheetLinear Equations & Inequalities Review SheetSystems of Equations & Inequalities Review SheetExponent Laws and Radicals Review SheetOperation
Subjects:
Grades:
8th - 9th
CCSS:
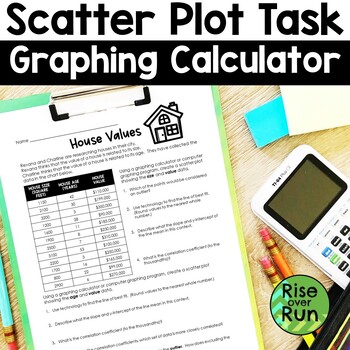
Scatter Plot Worksheet with Graphing Calculator Practice
Need a real world scatter plot activity where students use their graphing calculators? Grab this activity and help your students understand lines of best fit and calculating correlation coefficients!Students are given data on house sizes, house ages, and house values. They use a graphing calculator or computer program to plot the points and answer questions that follow.This is a great activity for partners to explore or for individual work. It can lead to some great math discussions!Answer key
Subjects:
Grades:
8th - 9th
Types:
CCSS:
Also included in: Algebra 1 and 8th Grade Math Curriculum Bundle for Entire Year
Showing 1-24 of 243 results

