11 results
Common Core HSS-ID.B.6 interactive whiteboards
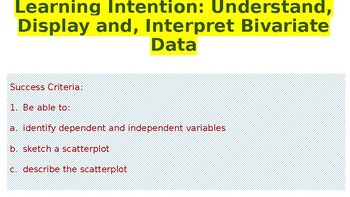
Bivariate Data
This PPT is an awesome tool for students who need understanding in Statistics and the application of it. It delve into the understanding, display and interpretation and reasoning of Bivariate displays whether given OR drawn by them.
Subjects:
Grades:
9th - 12th, Higher Education
CCSS:
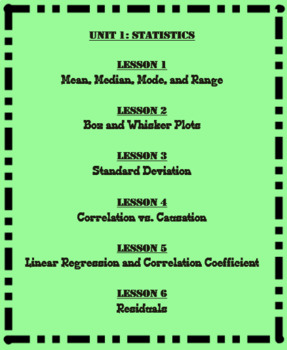
Unit 1-Statistics (Math 1)
This is the first Unit of the eight Units that I cover in Math 1. This unit is broken up in to six different lessons that are listed below. Each lesson includes a SMART Notebook presentation, a student note-taking guide, and an answer key. Also included in this unit are student flashcards, a test outline, and a 25 question multiple choice test.
Unit 1: Statistics
Lesson 1: Mean Median Mode Range Outliers and Skew
Lesson 2: Box and Whisker Plots
Lesson 3: Standard Deviation
Lesson 4: Correlati
Subjects:
Grades:
6th - 12th
CCSS:
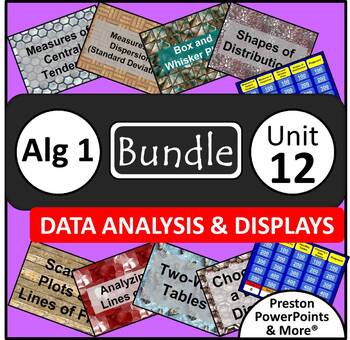
(Alg 1) Data Analysis and Displays {Bundle} in a PowerPoint Presentation
Algebra 1 Data Analysis and Displays {Bundle} in a PowerPoint PresentationThis is a bundle include the eight PowerPoint lessons below and two Quiz Show games, Jeopardy Style, for review.Measures of Central Tendency S.ID.2, S.ID.3Measures of Dispersion (Standard Deviation) S.ID.2, S.ID.3Box-and-Whisker Plots S.ID.1, S.ID.2, S.ID.3Shapes of Distributions S.ID.2, S.ID.3Quiz Show Game Central Tendencies and Dispersion S.ID.1, S.ID.2, S.ID.3Scatter Plots and Lines of Fit 8.SP.1, S.ID.6a, S.ID.6c, S
Grades:
8th - 10th
CCSS:
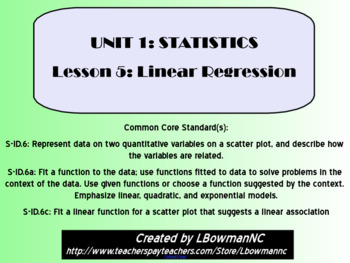
Linear Regression and the Correlation Coefficient (Math 1)
This lesson is the fifth of six lessons in the Math 1 Statistics Unit.
This lesson includes important vocabulary, examples (guided practice), and class work (independent practice). At the end of the presentation is a Ticket Out the Door that can be used as a formative assessment.
There is a note-taking guide for the students to fill out as the teacher goes through a SMART Notebook presentation.
Unit 1: Statistics
Lesson 1: Mean Median Mode Range Outliers and Skew
Lesson 2: Box and Whisker
Subjects:
Grades:
6th - 12th
CCSS:
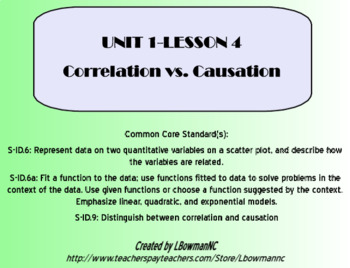
Correlation vs Causation (Math 1)
This lesson is the fourth of six lessons in the Math 1 Statistics Unit.
This lesson includes important vocabulary, examples (guided practice), and class work (independent practice). At the end of the presentation is a Ticket Out the Door for the students.
There is a note-taking guide for the students to fill out as the teacher goes through a SMART Notebook presentation.
Unit 1: Statistics
Lesson 1: Mean Median Mode Range Outliers and Skew
Lesson 2: Box and Whisker Plots
Lesson 3: Standard
Subjects:
Grades:
6th - 12th
CCSS:
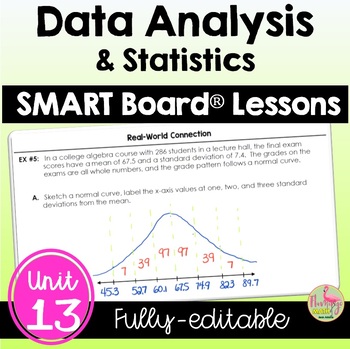
Data Analysis and Statistics SMART Board® Lessons (Algebra 2 - Unit 13)
Data Analysis & Statistics SMART Board Bundle:This bundle of SMART Board® presentations for Algebra 2 Honors students covers Unit 13: DATA ANALYSIS & STATISTICS. You have total freedom to alter and revise each fully-editable SMART Notebook® file. Then, you can teach and present your lesson with any compatible Interactive Whiteboard. There are 108 slides to cover the concepts in depth.The unit includes the following topics:1) Measures of Central Tendency2) Analyzing Data3) Working With S
Subjects:
Grades:
8th - 11th, Higher Education
CCSS:
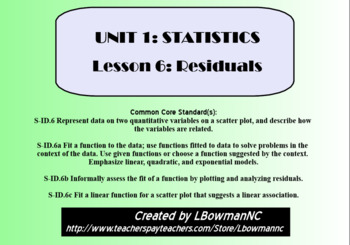
Residuals (Math 1)
This lesson is the last of six lessons in the Math 1 Statistics Unit.
This lesson includes important vocabulary, examples (guided practice), and class work (independent practice) on how to find the residual values for a linear regression model. At the end of the presentation is a Ticket Out the Door for the students.
There is a note-taking guide for the students to fill out as the teacher goes through a SMART Notebook presentation.
Unit 1: Statistics
Lesson 1: Mean Median Mode Range Outli
Subjects:
Grades:
6th - 12th
CCSS:
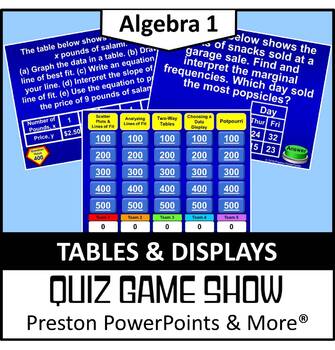
(Alg 1) Quiz Show Game Tables and Displays in a PowerPoint Presentation
Algebra 1 Quiz Show Game Tables and Displays in a PowerPoint PresentationThis Quiz Show game, Jeopardy Style, is a great way to review a chapter. There are 25 questions and a scoreboard so you don’t have to write it on a side board. Each page has the point value!This Quiz Show game covers all of the following:Scatter Plots and Lines of Fit 8.SP.1, S.ID.6a, S.ID.6c, S.ID.7Analyzing Lines of Fit S.ID.6b, S.ID.7, S.ID.8, S.ID.9Two-Way Tables 8.SP.4, S.ID.5Choosing a Data Display S.ID.1NEW: The les
Grades:
8th - 10th
CCSS:
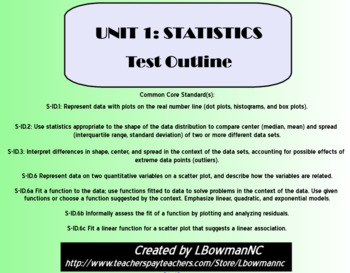
Statistics Test Outline (Math 1)
This outline briefly revisits the lessons presented to the students in the Math 1 Statistics Unit so that they have a quick reference sheet to aid them in studying!
Follow the outline up with the Flashcards that can be found in my store!
Subjects:
Grades:
6th - 12th
CCSS:
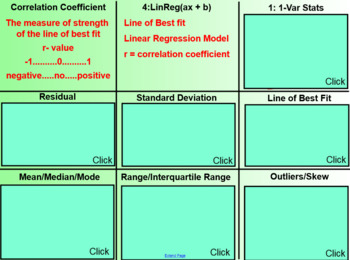
Statistics Flashcards (Math 1)
These flashcards will help the students review important vocabulary and concepts from the Math 1 Unit 1 Statistics Unit.
The flashcards can be pre-printed by the teacher and filled in by the students during a review before the test.
Unit 1: Statistics
Lesson 1: Mean Median Mode Range Outliers and Skew
Lesson 2: Box and Whisker Plots
Lesson 3: Standard Deviation
Lesson 4: Correlation vs Causation
Lesson 5: Linear Regression and the Correlation Coefficient
Lesson 6: Residuals
Subjects:
Grades:
6th - 12th
CCSS:
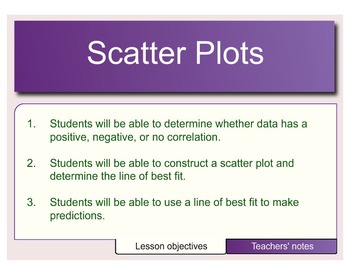
Scatter Plots
This lesson explores creating and analyzing scatter plots by determining the correlation: positive, negative, or no correlation. It also incorporates making predictions based on the line of best fit.
Negative Correlation, Data Display, Scatter Plot, Positive Correlation, Line of Best Fit, Best Fit Line, Correlation, No Correlation, Independent Variable, Dependent Variable
Subjects:
Grades:
7th - 9th
Types:
CCSS:
Showing 1-11 of 11 results

