81 results
Algebra 2 Common Core HSS-ID.B.6 resources
Linear, Exponential, & Quadratic Functions Regression Project | Scatter Plot PBL
Connect algebra to real life in this Graphing Linear, Exponential and Quadratic Functions Regression Project. This project based learning activity is perfect for students to write a linear, quadratic, or exponential equation, graph the scatter plot and function, and analyze the data. Students collect and analyze college tuition data to determine the linear, quadratic and/or exponential curve of best fit (regression), and predict future tuition costs. College Trend Project - Students will be able
Subjects:
Grades:
9th - 12th
Types:
CCSS:
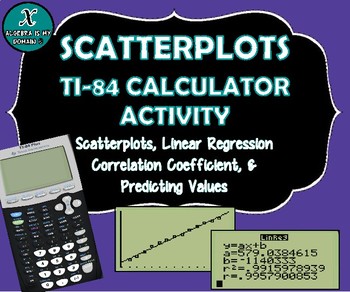
TI-84 CALCULATOR ACTIVITY - Data, Scatterplots, Regression & Line of Best Fit
This file includes four linear regression examples (all real-life data). The examples cover the following topics for the TI-84 graphing calculator:
* Creating a scatterplot
* Performing linear regression (finding the equation of the best-fit line)
* Interpreting the slope of the equation
* Calculating and interpreting the correlation coefficient
* Predicting values (using the linear regression equation)
The first example gives the step-by-step instructions to calculate all the necessary value
Subjects:
Grades:
7th - 12th, Higher Education
Types:
CCSS:
Math March Madness Full Tournament Project {BUNDLE}
Harness the excitement of NCAA March Madness with this huge project for secondary math teachers that follows all stages of the tournament! This Common Core aligned bundle comes with bonus parts not sold individually in my store so you can create a rich immersion in the tournament, practice probability and statistics and learn some interesting new ones along the way! Save $3 plus get bonus content by bundling!You can pick and choose which parts you would like to incorporate, or follow my schedu
Subjects:
Grades:
6th - 12th, Higher Education
Types:
Urban Sprawl -- Polynomial Modeling - 21st Century Math Project
This 21st Century Math Project is an opportunity to bring polynomial functions into the real world. Along using polynomial functions and developing regressions skills, students will engage in thoughtful city planning from the perspective of a member of the City Commission for Urban Planning.In this 10 page document you will be given a mapping to the Content Standards, an outline for how to implement the unit and two main assignments. ***THIS PRODUCT HAS BEEN UPDATED WITH A GOOGLE SLIDES INTERACT
Subjects:
Grades:
8th - 12th
Types:
CCSS:
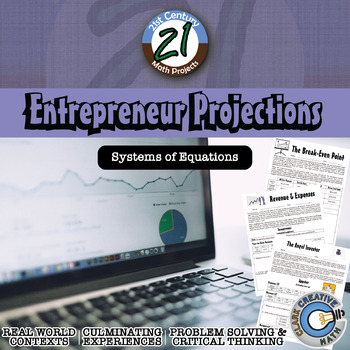
Entrepreneur Projections - Financial Literacy & Systems - Math Project
Student put on their entrepreneur and investor hat to make expense and revenue projections for a business in this 21st Century Math Project. Students will work through a variety of entrepreneurial dilemmas and help small business owner make decisions relative to their break even point. In the final project, students will play the role of an Angel Investor, use regression to project revenue and expenses and analyze a financial forecast. Download the preview to see everything included! ***THIS PRO
Subjects:
Grades:
7th - 12th
Types:
CCSS:
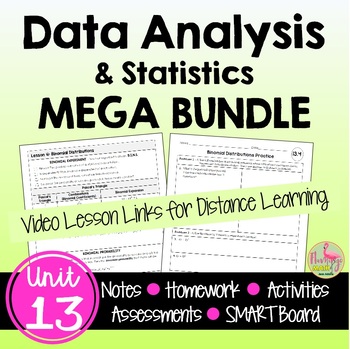
Data Analysis and Statistics MEGA Bundle (Algebra 2 - Unit 13)
This is a MEGA Bundle of GUIDED NOTES WITH VIDEO LESSONS for your distance learning needs, homework, daily warm-up, content quizzes, mid-unit and end-unit assessments, review assignments, and cooperative activities for Algebra 2 Honors UNIT 13: DATA ANALYSIS & STATISTICS. #distancelearningtpt⭐Guided Student Notes⭐ 8-Page-Bound-Book-Style Foldables⭐ Google Slides®⭐ Fully-editable SMART Board® Slides⭐ Homework/Practice assignment⭐ Lesson Warm-Up (or exit ticket)⭐Daily Content Quiz (homework ch
Subjects:
Grades:
8th - 11th, Higher Education
CCSS:
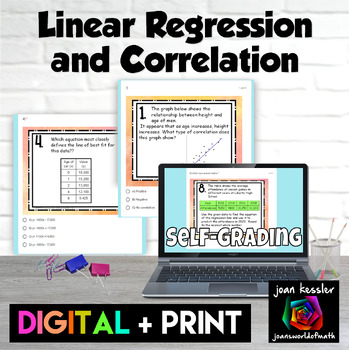
Linear Regression and Correlation Digital plus Print with TI-84 notes
This Linear Regression and Correlation activity is a great way for your students to practice their skills. There are 12 well chosen representative problems. Digital and printable PDF versions included. Questions include:CorrelationLine of Best FitProjecting TrendsFind the linear regression from a tableFind the linear regression from a scatter plotDetermining the correlation coefficientThe editable digital self checking version can be used as an Quiz, HW, or Paperless worksheet and is designed
Subjects:
Grades:
8th - 10th
Types:
CCSS:
High School Data Analysis Project
This project covers a large range of data analysis methods. There are eleven total parts to the project.
Part One: the students have to collect data from 20 students outside of the classroom. Directions specify to ask students from each grade level.
Part Two: Measures of Center and Variation. Students will calculate mean, median, mode, range, and standard deviation for some of the data collected. Definitions of each term are included.
Part Three: Box-And-Whisker Plot. Students will create t
Subjects:
Grades:
9th - 12th
Types:
CCSS:
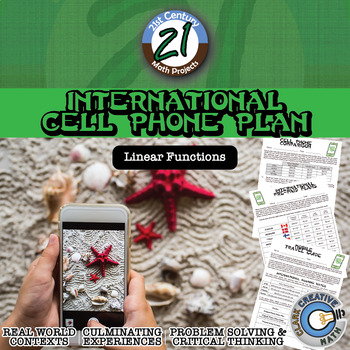
International Cell Phone Plan -- Linear Equations - 21st Century Math Project
As your students try to sneak cell phone usage into your lesson, make them consider the costs associated with international travel in this 21st Century Math Project!In this project, you will receive three separate assignments. In “Cell Phone Comparison” students will become familiar with writing linear equations from cell phone data and using the equations.In “International Pre Paid Plans” students will continue practicing writing and using linear equations. The data is from 11 different countri
Subjects:
Grades:
7th - 12th
Types:
CCSS:
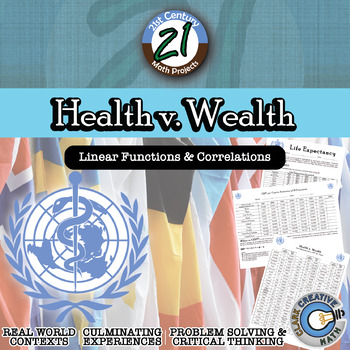
Health v. Wealth -- International Data & Correlation - 21st Century Math Project
Correlations and causation should be abundantly clear when students examine data of the Health and Wealth of over 80 nations around the world. The world is ever-changing and it is important for students to have a basic level of global awareness. In this 21st Century Math Project, students will use real world data to model regression functions, examine correlations and predict the future. In this project students will investigate global data sets to examine potential correlations related with the
Subjects:
Grades:
7th - 12th
Types:
CCSS:
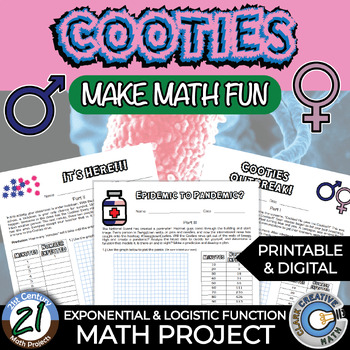
Cooties -- Pandemics -- Exponential & Logistic - 21st Century Math Project
It was an ordinary day. It was. Then came the screams, “Cooties! He gave me Cooties!!!” This was soon followed by “Cooties! She gave me Cooties!!!” Soon classes began to fall over (still breathing), but in an unconscious state. Bodies started turning blue and pink. A contagion was among them. The teachers, who have to receive Cooties immunizations to get their licensure, were left stunned.Turn your Algebra 2 or Pre-Calculus into a contagion command center with this 21st Century Math Project. Spe
Subjects:
Grades:
8th - 12th
Types:
CCSS:
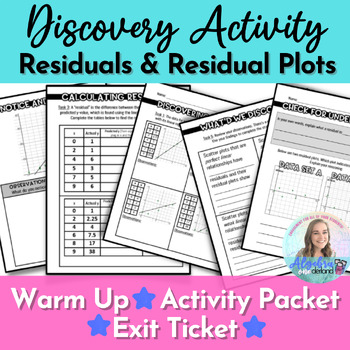
Residuals and Residual Plots Discovery Lesson Activity for Algebra 1
Make understanding residuals and residual plots east with this hands-on, discovery activity packet. Students will understand how residuals, regression and line of best fit connect and what the residuals tell us about the fit of the line. Included:A "Notice and Wonder" Task to start the lessonAn activity packet with three observation tasks related to line of best fit / linear regression, scatter plots, residuals and residual plots; culminating in a task that generalizes the concept of residuals a
Subjects:
Grades:
8th - 12th
Types:
CCSS:
Also included in: Algebra 1 Digital Activities for Google Slides Bundle #1!
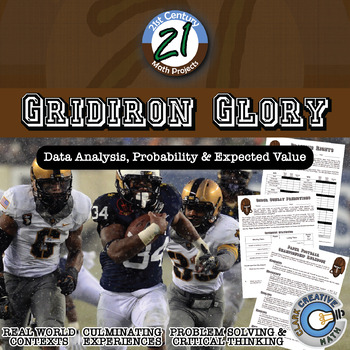
Gridiron Glory -- "Big Game" Data & Paper Football - 21st Century Math Project
I have heard that Americans like Football. I have also heard about an important game that happens in February. I have heard that it's a day that nachos dread. In this 21st Century Math Project, students will complete a variety Football-based assignments related to the Statistics strands of the Common Core. The project caps off with a Paper Football tournament that asks students to use expected value to guide their decisions!This product includes 3 prep assignments that reaches a variety of learn
Subjects:
Grades:
6th - 12th
Types:
CCSS:
Also included in: Probability & Expected Value Unit Bundle - Distance Learning Compatible
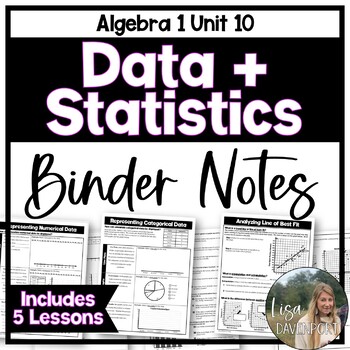
Data and Statistics - Editable Algebra 1 Binder Notes
This bundle includes editable binder notes and practice on 5 algebra 1 skills related to data and statistics. These notes provide the teacher and students with an organized set of guided notes and in class practice. Each topic includes 2 pages (1 page double-sided) of notes and examples. The following topics are included:Representing Univariate Numerical Data (using Line Plots, Histograms, and Box Plots)Representing Univariate Categorical Data (using Line Plots, Circle Graphs, and Bar Graphs)
Grades:
7th - 9th
CCSS:
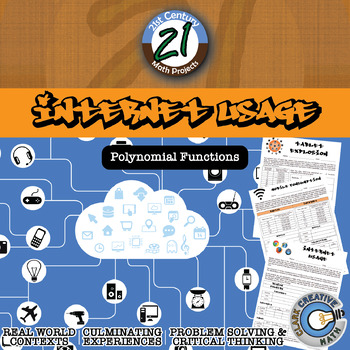
Internet Usage -- Intl Polynomial Regression - 21st Century Math Project
Experts believe that in the next twenty years the internet will be as integrated into our life as electricity. Today, the internet holds more information than you could read in 1,000 lifetimes. Today, there are 644 million active websites and that number is growing each day. In the United States, we may take for granted how easy it is to get on the internet. In different parts of the world this isn’t the case. Bring Internet Usage Statistics into your Algebra 2 / PreCalculus classroom with polyn
Subjects:
Grades:
8th - 12th
Types:
CCSS:
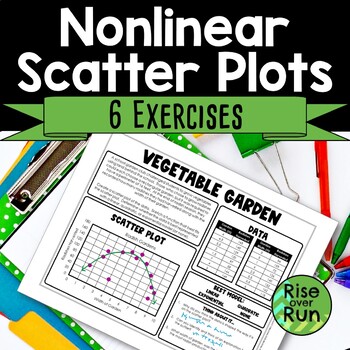
Nonlinear Scatter Plot Practice Activities
Explore non-linear scatter plots with these activity sheets! Included are 6 different sheets that each include a description of data collection, a table of data, a graph, and questions to encourage thinking. Students use the given data to create a scatter plot, determine if the relationship is linear, quadratic, exponential, or none of those. Then they sketch a line of best fit and answer questions. A blank template is included as well so students can create their own scatter plots. These works
Subjects:
Grades:
9th - 12th
Types:
CCSS:
Also included in: Algebra 1 and 8th Grade Math Curriculum Bundle for Entire Year

Introduction to Exponential Functions Mini-Unit Resources (11 files)
If you would like to download just one of these files, contact me and I'll set up a listing for you. A single file is $1.
This file includes 11 resource files for an introduction to exponential functions:
- Evaluating Exponential Expressions
- Graphing Exponential Functions
- Exponential Growth and Decay
You will download a .zip file from which 11 .doc files can be extracted.
Each file includes a key for the notes and practice problems. The files include guided notes, homework, and two m
Subjects:
Grades:
8th - 10th
Types:
CCSS:
Also included in: All Algebra Resources (discounted bundle)
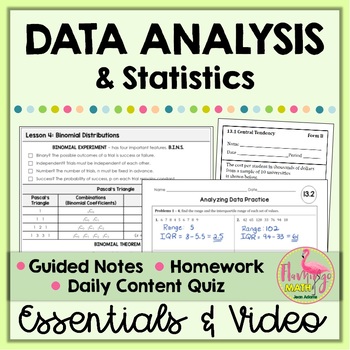
Data Analysis and Statistics Essentials (Algebra 2 - Unit 13)
Data Analysis & Statistics Essentials (Unit 13) is a complete set of GUIDED NOTES WITH VIDEO LESSONS for your distance learning needs, homework, warm-up exercises and daily content quizzes for your Algebra 2 Honors students. You will also find a set of GOOGLE SLIDES for your presentation needs.Guided Notes Format:The unit is organized into six lessons, aligned to CCSS, that will take approximately 15 instructional days. There is ample space for writing and recording knowledge in this format.
Subjects:
Grades:
8th - 11th, Higher Education
CCSS:
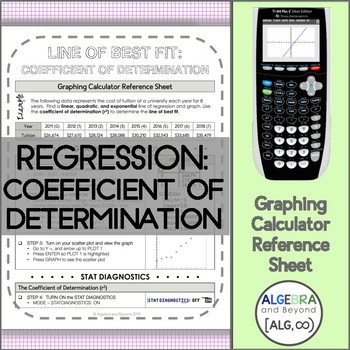
Linear, Quadratic, and Exponential and Coefficient of Determination | TI-84
This graphing calculator reference sheet shows students how to find the lines of regression for linear, quadratic, and exponential functions and determine the line of best fit using the coefficient of determination on the Ti-84 graphing calculator.Teaching graphing calculator skills to help students with: • Speed• Making connections• Checking for accuracy• Leaping hurdles*Reference sheets can be used with a TI-84 or Ti-83 graphing calculator. Please look at the preview to find out more informati
Subjects:
Grades:
9th - 12th
Types:
CCSS:
Algebra 1 - ENTIRE YEAR - Exit Tickets for Google Forms™
About This Resource:This is a bundle of all 88 of my Google Forms Exit Tickets that relate to Algebra 1 content and their standards. The instructions for each exit ticket are easy to follow for you to make a copy of the Google Form into your Google Drive. Then you can assign to your students using Google Classroom or some other method.What's Included:Above you can preview each of the exit tickets to see what you will receive. I am continually adding more exit tickets to the collection. You will
Subjects:
Grades:
9th - 11th
Types:
CCSS:
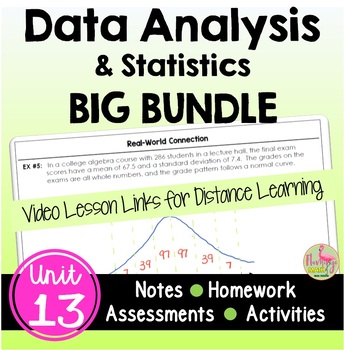
Data Analysis BIG Bundle (Algebra 2 - Unit 13)
This is a BIG Bundle of GUIDED NOTES WITH GOOGLE SLIDES and VIDEO LESSONS for your distance learning needs, homework, daily warm-up, content quizzes, mid-unit and end-unit assessments, review assignments, and cooperative activities for Algebra 2 Honors UNIT 13: DATA ANALYSIS & STATISTICS. #distancelearningtptWhat is included in each lesson?The unit is organized into SIX lessons, that will take approximately 15 instructional days.⭐ Guided Student Notes⭐ 8-Page Bound-Book Style Foldable⭐ GOOGL
Subjects:
Grades:
8th - 11th, Higher Education
CCSS:
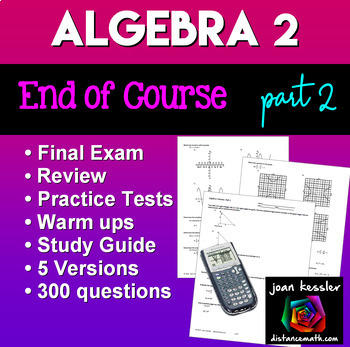
Algebra 2 Final Exam or Review Packet Part 2
This Algebra 2 - Part 2 Review can be used as a Final Exam, or Warm Ups and includes 300 Questions in 5 Versions. It can also be used as a Pretest or review for many topics in PreCalculus. Since Algebra 2 Curriculum differs between schools, I have created this to supplement Algebra 2 End of Course Reviews with 250 Questions Part 1 with topics found in many Algebra 2 curricula, especially those that are Common Core or similar.TOPICS INCLUDE • Conics: Circles, Ellipses, Hyperbolas, Parabolas
Subjects:
Grades:
9th - 12th
Types:
CCSS:
Also included in: Algebra 2 EOC Review or Exam Bundle
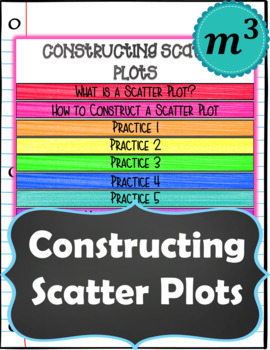
Constructing Scatter Plots Digital Notes & 2 Quizzes (GOOGLE) (Distance Learning
Product DescriptionGoogle Slides Digital Interactive Notes. The notes are everything beneficial of an interactive notebook without all the paper, glue, scissors, etc.Content:Students will be able to construct scatter plots given a set of data. Students will be able to identify positive correlation, negative correlation, and no correlation. Includes:Google Slides: Constructing Scatter Plots Digital NotesGoogle Forms: Self Grading Quick Check Quiz 1 & Self Grading Quick Check Quiz 2Answer KeyT
Subjects:
Grades:
6th - 9th
Types:
CCSS:
Also included in: 8th Grade Math Digital Notes GROWING BUNDLE (Distance Learning)
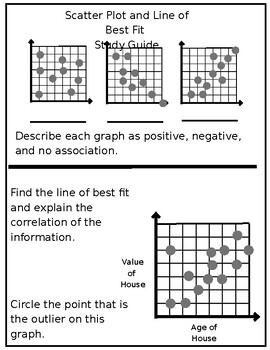
Scatter Plot Review, Study Guide, Test - Algebra - No Prep
Introducing our comprehensive Scatterplot and Line of Best Fit Study Guide, Test, and Review Activity, designed specifically for teachers and their Algebra 1 and 2 students. This educational resource is ideal for teaching the key concept of scatterplot points.The study guide offers a concise yet comprehensive overview of scatterplots, emphasizing data interpretation and the process of drawing a line of best fit. Students will receive step-by-step guidance on creating accurate scatterplots and co
Subjects:
Grades:
6th - 12th
CCSS:
Showing 1-24 of 81 results


