TPT
Total:
$0.00
Selected
Subjects
14 results

Science Common Core HSS-ID.B.6 resources
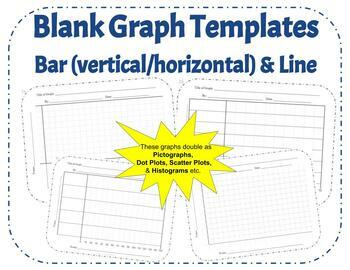
Preview of 42 Blank Graph Templates: Horizontal & Vertical Bar Graph, Line Graph, Printable
42 Blank Graph Templates: Horizontal & Vertical Bar Graph, Line Graph, Printable

Looking for an array of printable graph templates for all your future bar and line graph needs? Look no further! With 42 different templates ranging for bar graphs, to line graphs, varying in X values and Y values, this combination should be the last graph download you need to worry about for your class. These graphs can even be used as Histograms, Dot Plots, Scatter Plots, or a variety of other graphs to suit the needs of your classroom.I created this template to require all the basics of gr
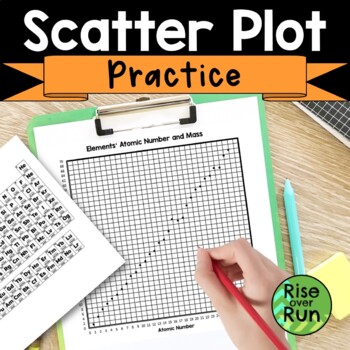
Preview of Scatter Plot Practice Worksheet

Scatter Plot Practice Worksheet

Created by
Rise over Run
In this practice activity, students graph points to represent elements' atomic number and mass. They create a scatter plot by graphing the points. This is a great way connect what they are learning in science! Students will need to reference the Periodic Table of Elements to complete their scatter plots. (One is provided to print if needed.)Once they create the scatter plot on the coordinate plane provided, they answer questions about the type of association and determine an equation to fit th
Preview of Hubble's Law & Expansion of the Universe Worksheets/Packet
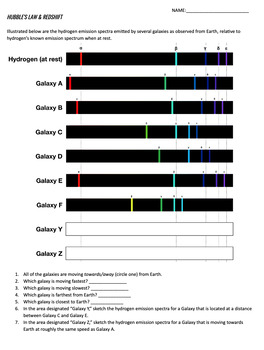
Hubble's Law & Expansion of the Universe Worksheets/Packet

This resource consists of three full-color worksheets that ask students to approach and work with Hubble's Law in three different ways.Worksheet #1 - HUBBLE'S LAW BASICS: Students use the famous "raisin bread" analogy to understand how Hubble's observations of receding galaxies led him to conclude that space itself was expanding. Students use a ruler to measure the before and after distances between "raisins" in an illustration of rising raisin bread. They find that no matter which pair of raisi
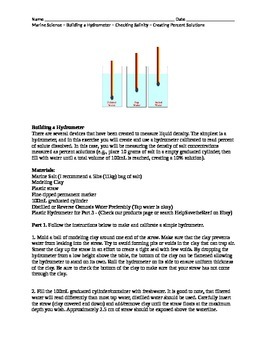
Preview of Marine Science Biology Making a Hydrometer Making Percent Solutions
Marine Science Biology Making a Hydrometer Making Percent Solutions

Created by
HelpSavetheReef
This laboratory experience enables students to create a hydrometer using clay and straws to measure unknown solutions. Students begin by calibrating their devices using percent solutions that they must make. They can then use their device to measure unknown solutions provided by the instructor. Students are asked to convert units of measure. Additional research questions are provided that go beyond the laboratory activity.
Preview of Graphing in Science: A Google Slides Lesson PLUS Guided Notes Handout!
Graphing in Science: A Google Slides Lesson PLUS Guided Notes Handout!

This EDITABLE Google slides (powerpoint) presentation AND guided notes handout covers all of the essential information students need to create and analyze graphs in science. This lesson is designed to refresh students on the concepts of creating graphs using scientific data, analyzing relationships between independent and dependent variables, and includes lots of examples and practice opportunities! This lesson can be used to introduce the important concepts of graphing in science, or it can be
Preview of Ohm's Law Unit (4 items: notes, lab, electrocution math, mixed practice math)

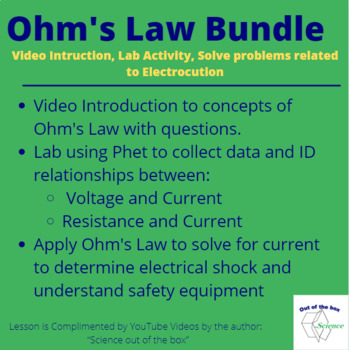
Ohm's Law Unit (4 items: notes, lab, electrocution math, mixed practice math)

Students will first use a video to take guided notes about Ohm's Law. The video has a lot of animations and analogies to help students understand the relationship between voltage, current and resistance. Introduction to Ohm's Law Video sheet for YouTube video created by the author. Analogies, Demos and animations are used to explain the relationship between voltage, current and resistance. Easy to remember memory tools are given to remember volts, amps and ohms. Great way to introduce the
Preview of Teaching with Baseball Statistics

Teaching with Baseball Statistics

Created by
Cecile Greene
I use this activity to teach my science students how to model an idea using data. Students learn to predict the outcomes of a baseball pitcher based on their last 3 years of stats. Students learn to analyze their data and determine trends in the data. Students also learn to compare data from their pitcher to other students' pitchers (collaboration). Students also must be able to/learn to accurately graph their data. There is also a research component as students must research their pitcher's
Preview of Making Meaning of Data Using Basic Statistics – Plus Statistics with EXCEL
Making Meaning of Data Using Basic Statistics – Plus Statistics with EXCEL

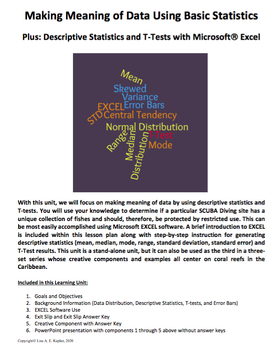
This learning unit includes two files ­– a PDF document and a PowerPoint presentation. The PDF includes the following components and can be used solely by the teacher or modified to remove the assessment pieces and distributed to the students. 1. Goals and Objectives2. Background Information a. Data Distribution, Descriptive Statistics, T-tests, and Error Barsb. EXCEL Software Use3. Assessmentsa. Exit Slip and Exit Slip Answer Keyb. Creative Component with Answer Key All of the background info
Preview of Population Graph Analysis

Population Graph Analysis

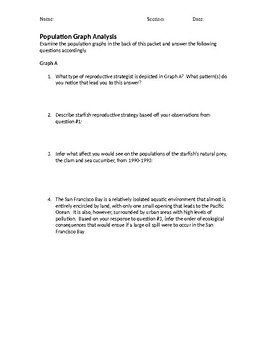
Students examine graphs showing population fluctuations of two related species in the San Francisco Bay area and answer questions based off of their observations. The activity reviews a plethora of terms and concepts pertaining to Ecology and Biology, such as reproductive strategies, carrying capacity, symbiotic relationships, etc.
Preview of Experimental Variables and Graphing

Experimental Variables and Graphing

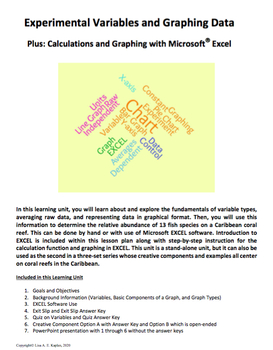
This learning unit includes two files ­– a PDF document and a PowerPoint presentation. The PDF includes the following components and can be used solely by the teacher or modified to remove the assessment pieces and distributed to the students. 1. Goals and Objectives2. Background Information a. Variables, Components of a Graph, Graph Typesb. EXCEL Software Use3. Assessmentsa. Exit Slip and Exit Slip Answer Keyb. Quiz on Variables and Answer keyc. Creative Component Options A with Answer Key and
Preview of High School Physics and Physical Science - Mini Lab: Projectile Motion

High School Physics and Physical Science - Mini Lab: Projectile Motion

Created by
The Physics Lab
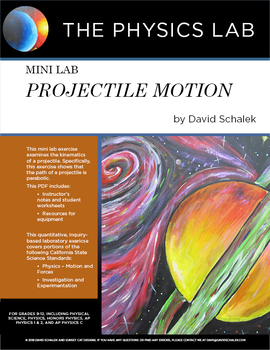
This quantitative, inquiry based laboratory exercise for physics or physical science classes examines the kinematics of a projectile. The exercise demonstrates that the path of a projectile is parabolic. Applicable to Physical Science, Physics, Honors Physics, and AP Physics classes.Instructor's Notes and Student Worksheets are included.This laboratory exercise can be used with Mini Lab: Projectiles.This exercise covers portions of the following California State Science Standards:Physics - Motio
Preview of Data Discovery

Data Discovery

Use this activity at the beginning of the school year in Science class to teach and refine data collection skills, build conversations about data analysis, and graphs vs. tables. Students will use classroom items and collect data from their peers to determine how to graph and organize information they have collected. Scientific method, data analysis, or an icebreaker for science.
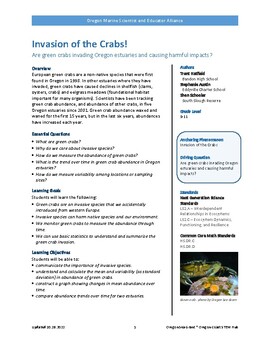
Preview of Invasion of the Crabs! Lesson Plan and Activities
Invasion of the Crabs! Lesson Plan and Activities

Created by
Sea Grant
Are green crabs invading Oregon estuaries and causing harmful impacts?This lesson plan from Oregon Sea Grant includes:Introduction lesson with video resources"Introduction to Invasive Green Crabs in Oregon" activity with narrated presentation and slides, and handouts"Species on the Move" activity with article and worksheet"Green Crab Abundance" activity with student dataset handout and worksheet, and teacher guidance and answer key"Data analysis" activity for student presentations of dataField t
Preview of Animal Collective: Interdisciplinary Science Mini-Unit

Animal Collective: Interdisciplinary Science Mini-Unit

This FREE, interdisciplinary mini-unit is all about how group behavior can produce surprising problems...and solutions! The Gist: Students will draw their own social networks, ponder the meaning of complexity and begin to notice unexpected patterns that emerge around them, unnoticed. Through hands-on activities and digital experiments, students will discover how complexity research enriches our daily lives.Driving Questions: Why do humans and other animals live in groups?How do simple behavioral
Showing 1-14 of 14 results

Find Science resources | TPT

Importance of learning science

Learning science is particularly important for students as it equips them with the essential knowledge and skills to make sense of the world around them. Science education is not just about memorizing facts. It fosters critical thinking, inquiry, and problem-solving abilities. These skills are not only useful in school but also in everyday life beyond the classroom.

Benefits of learning science

Learning science offers many benefits to students both in school and beyond. In fact, it helps students:

  • Question the world around them and seek evidence-based explanations
  • Cultivate their ability to observe, experiment, and analyze data
  • Nurture a sense of curiosity, awe, and wonder about the natural world
  • Understand natural phenomena and the laws that govern the universe

With a solid foundation in science, teachers can help empower students to think critically, solve problems, make informed decisions, and engage with the world around them in meaningful ways.

Teaching with science resources

One of the best parts about science class is all of the possibilities for hands-on, collaborative learning! Think: labs, experiments, inquiry-based activities, and design challenges. These activities encourage students to explore scientific concepts by observing, asking questions, and conducting investigations. Additionally, with small group centers, students can engage in group experiments, discussions, and projects that require them to collaborate, share ideas, and solve problems together.

Discover printable and digital science resources

If you’re a teacher or parent looking for printable or digital science resources, TPT has an extensive array of instructional materials for every learning need, topic, or grade level. Whether you're learning about plant parts or butterfly life cycles, or exploring advanced topics like the anatomy of a cell or Newton’s laws of motion, we've got you covered.

On TPT, science resources come in various forms: from labs and worksheets to craftivities and doodle notes. They can be used to enhance learning, assess a student’s mastery of science concepts, or to reteach a tricky topic. With plenty of TPT resources at your fingertips, teaching and learning science will be so much easier. Plus, you can expand students’ knowledge even further by exploring TPT math resources, which are frequently paired with science lessons.

Frequently asked questions about teaching science

What types of science lessons are available on TPT?

There are many different types of science resources sold by Sellers on TPT. Some popular science lessons include biology, earth sciences, chemistry, environment, engineering, and anatomy.

How do I find science lessons on TPT?

Educators can save time preparing science lessons with resources created by experienced teachers. Simply start a search for science resources on the TPT marketplace, and filter by grade level, price, and/or resource type to find materials that've been proven to work in classrooms like yours. No matter what you’re teaching, there are plenty of science lessons and activities sold by Sellers on TPT that are tailored to meet your students' skill levels.

How can I make my science lessons fun and engaging?

Students learn best when they're engaged! Sprinkle a little fun into your science lessons and make them feel like real scientists by investigating everyday objects, exploring the world outside the classroom, and doing hands-on and collaborative experiments and design challenges.