51 results
Graphing Common Core HSS-ID.B.6 resources
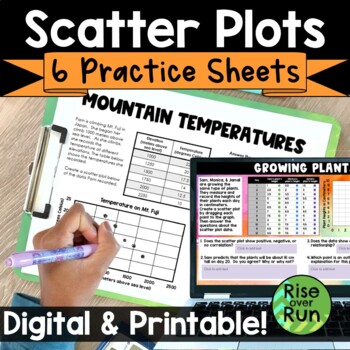
Scatter Plots & Line of Best Fit Practice Worksheets
Practice using scatterplots with these six activities. They can be used as bell ringers, exit tickets, homework, or just general practice. Students graph points, interpret data, and look for types of correlation with these practice sheets. All practice sheets are included as printable PDFs and interactive Google Slides. 6 scatter plot activities are included:Test Grades Scatter Plot PracticeMountain Temperatures Scatter Plot PracticeGrowing Plants Scatter Plot PracticeHair Length Data Collectio
Grades:
8th - 9th
Types:
CCSS:
Also included in: 8th Grade Math Activities & Lessons Bundle for the Whole Year
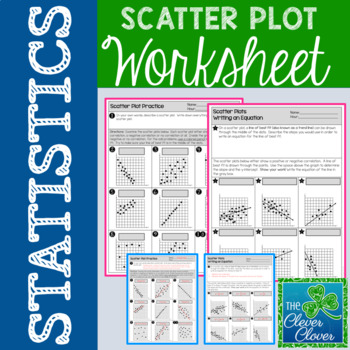
Scatter Plot Worksheet
Scatter Plot Worksheet
This resource allows students to explore scatterplots with a two page worksheet. Students are asked to define scatterplots in their own words. Nine questions ask students to identify the type of correlation (positive, negative or no correlation) that exists between two variables. Students are also asked to describe the steps used to write an equation for the line of best fit. Six additional questions require students to calculate the slope and determine the y-intercept
Subjects:
Grades:
6th - 9th, Adult Education
Types:
CCSS:
Also included in: Scatter Plot Mini-Bundle
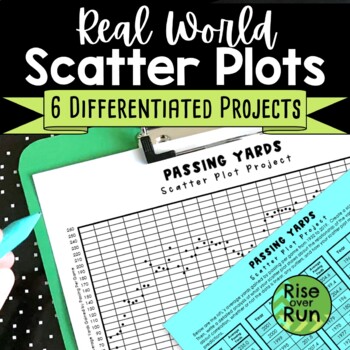
Scatter Plot Project with Real World Sports Data
Practice creating and analyzing scatter plots with these six differentiated real world projects. Students are provided statistics for a sport and must graph the data. Then, they write an analysis describing correlation, whether or not the data is linear, any outliers, and how the scatter plot might be used to make predictions. The scatterplots range from 38 points to 149 points, so they can be used to differentiate. The scatter plots will take a little time to plot, but they result in real
Subjects:
Grades:
8th - 9th
Types:
CCSS:
Also included in: 8th Grade Math Activities & Lessons Bundle for the Whole Year
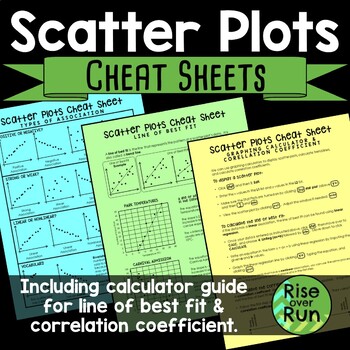
Scatter Plot Cheat Sheets Printable Guided Notes
Detailed sheets for the following topics: •Types of Association & VocabularyThis page shows examples of positive, negative, strong, weak, linear, and nonlinear association. It also shows clusters and outliers.•Line of Best FitThis page explains what a line of best is (or trend line) along with examples and nonexamples. It has 2 real world connections and how to interpret the line of best fit.•Graphing Calculator Guide & Correlation CoefficientThis sheet gives step by step instructions fo
Subjects:
Grades:
8th - 9th
CCSS:
Also included in: 8th Grade Math Activities & Lessons Bundle for the Whole Year
Scatter Plots Bundle of Activities for Algebra 1
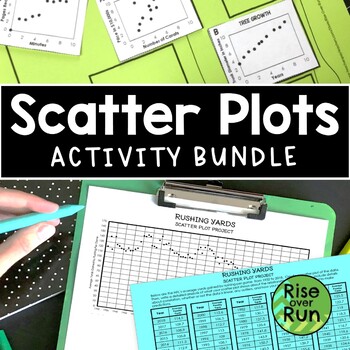
Engage students in learning about scatter plots with this bundle of activities! The activities and lessons include real world examples to help students see the relevance and importance of scatter plots!Included:Scatter Plot Experiment ActivityScatter Plot Practice Sheets (Six Worksheets)Math Meets Science TaskCorrelation Coefficient Lesson and Card MatchScatter Plot Projects (Six Topics)Scatter Plots Cheat SheetsScatter Plot Task using a Graphing CalculatorCorrelation vs Causation Info SheetThe
Grades:
8th - 9th
Types:
CCSS:
Algebra 1 Curriculum
Get a complete High School Algebra 1 curriculum including units on solving equations and inequalities, linear functions, exponents and exponential functions, factoring polynomials, quadratics, and more! These ready-to-use Algebra 1 resources include everything you need to teach high school algebra to your on-level or lower-level/special education class. Supplements would be needed for an honors class.Each unit contains guided notes, practice worksheets for the classroom and/or homework, activiti
Grades:
8th - 11th
CCSS:
42 Blank Graph Templates: Horizontal & Vertical Bar Graph, Line Graph, Printable
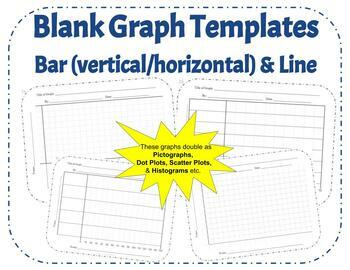
Looking for an array of printable graph templates for all your future bar and line graph needs? Look no further! With 42 different templates ranging for bar graphs, to line graphs, varying in X values and Y values, this combination should be the last graph download you need to worry about for your class. These graphs can even be used as Histograms, Dot Plots, Scatter Plots, or a variety of other graphs to suit the needs of your classroom.I created this template to require all the basics of gr
Grades:
4th - 12th
Types:
Nonlinear Scatter Plot Practice Activities
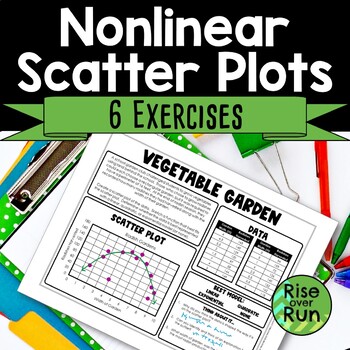
Explore non-linear scatter plots with these activity sheets! Included are 6 different sheets that each include a description of data collection, a table of data, a graph, and questions to encourage thinking. Students use the given data to create a scatter plot, determine if the relationship is linear, quadratic, exponential, or none of those. Then they sketch a line of best fit and answer questions. A blank template is included as well so students can create their own scatter plots. These works
Subjects:
Grades:
9th - 12th
Types:
CCSS:
Also included in: Algebra 1 and 8th Grade Math Curriculum Bundle for Entire Year
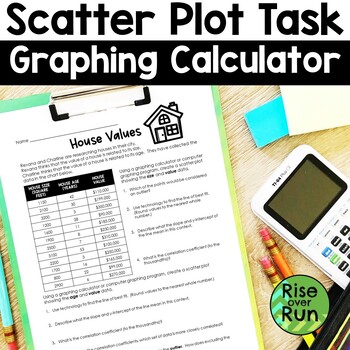
Scatter Plot Worksheet with Graphing Calculator Practice
Need a real world scatter plot activity where students use their graphing calculators? Grab this activity and help your students understand lines of best fit and calculating correlation coefficients!Students are given data on house sizes, house ages, and house values. They use a graphing calculator or computer program to plot the points and answer questions that follow.This is a great activity for partners to explore or for individual work. It can lead to some great math discussions!Answer key
Subjects:
Grades:
8th - 9th
Types:
CCSS:
Also included in: Algebra 1 and 8th Grade Math Curriculum Bundle for Entire Year
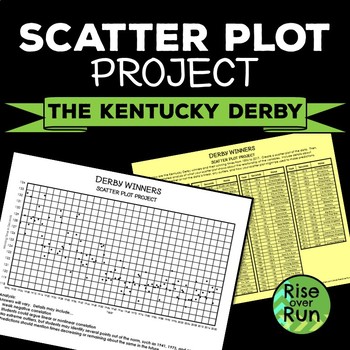
Scatterplot Project with Real World Stats from the Kentucky Derby
Practice creating and analyzing scatter plots with this project. Students are provided statistics for winning horses and must graph the data. Then, they write an analysis describing correlation, whether or not the data is linear, any outliers, and how the scatter plot might be used to make predictions. This is one of the projects in my Differentiated Scatter Plot Projects!Thank you for your interest in this resource from Rise over Run. Related Resources:Scatter Plot Practice WorksheetsScatter
Grades:
8th - 9th
Types:
CCSS:
Also included in: Algebra I Sub Plans Bundle with Activities

Statistics Survey Project - Project Based Learning (PBL) with Math
Watch your students dive into the world of math as they create, execute, and analyze their own survey! Students will demonstrate mastery of data gathering, survey sampling, developing appropriate survey questions, data tables, Direct Variation, discrete graphs, dot plots, box and whisker graphs, and calculating the inter-quartile range.The Unique Survey Project is highly engaging, capitalizing on the innate curiosity of the adolescent mind. You will love the low-prep instructional guide. Your st
Subjects:
Grades:
6th - 10th
Types:
Also included in: Fun with Ratios Activities Bundle - 7th Grade PBL with Math
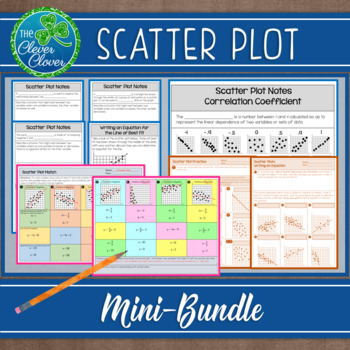
Scatter Plot Mini-Bundle
This resource includes six half pages of notes that are perfect for interactive notebooks. The first three pages introduce students to positive, negative and no correlation scatter plots. Students are asked to describe real world situations that might exist for each type of correlation. Students will graph three different sets of data in order to visualize the different types of scatterplots. Definitions for the line of best fit and correlation coefficient are provided. Each one of the half p
Subjects:
Grades:
6th - 9th, Adult Education
CCSS:
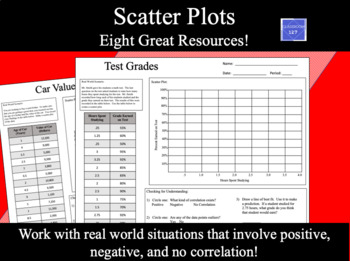
Scatter Plots Worksheets
This product provides students with a great opportunity to practice creating and reading scatter plots.This product containsThree real world scenarios that have students creating and reading scatter plots that have a positive correlation.Three real world scenarios that have students creating and reading scatter plots that have a negative correlation.One real world scenario that have students creating and reading a scatter plot that has no correlation.One blank template that allows students to ga
Subjects:
Grades:
7th - 9th
Types:
CCSS:
Also included in: 8th Grade Math Resources MEGA Bundle
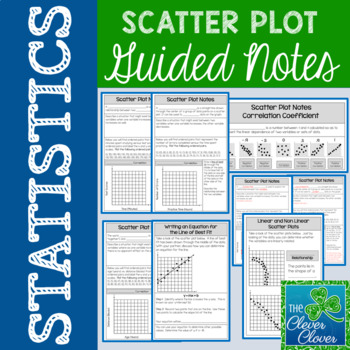
Scatter Plot Notes
This resource includes six half pages of notes that are perfect for interactive notebooks. The first three pages introduce students to positive, negative or no correlation scatter plots. Students are asked to describe real world situations that might exist for each type of correlation. Students will graph three different sets of data in order to visualize the different types of scatterplots. Definitions for the line of best fit and correlation coefficient are provided. Each one of the half pa
Subjects:
Grades:
6th - 9th, Adult Education
Types:
CCSS:
Also included in: Scatter Plot Mini-Bundle
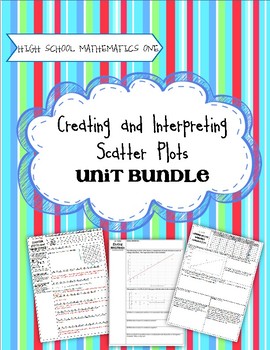
High School Math 1: Scatter Plots and Correlation
Task-Based Learning gets students intrinsically motivated to learn math! No longer do you need to do a song and dance to get kids interested and excited about learning. The tasks included in this unit, followed by solidifying notes and practice activities, will guarantee that students understand the concepts. This unit will effectively teach how to create and interpret scatter plots, calculate a linear model for best fit, calculate a correlation coefficient, and how to use a residual to deter
Subjects:
Grades:
8th - 10th
Types:
CCSS:
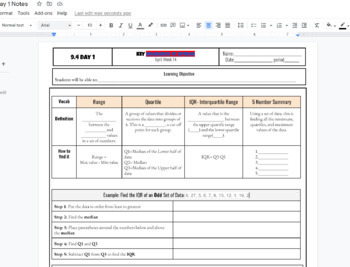
IQR interquartile Range and 5 number summary box and whisker plot Notes
IQR interquartile Range and 5 number summary box and whisker plot Notes including Q1, Q2, Q3, Min and Max and step by step both examples of finding the IQR and creating a box and whisker plot. Used in HS math 1 class WITH KEY INCLUDED AS a link to a printable PDF
Subjects:
Grades:
7th - 12th, Higher Education, Adult Education
CCSS:

Fun with Ratios Activities Bundle - 7th Grade PBL with Math
The purpose of the Fun with Ratios Activities Bundle is to give students the opportunity to use creativity to apply ratios, proportions, and percentages in real-world settings. This bundle includes three unique tasks: Black Friday Mastery Task, Direct Variation Poster Mastery Task, and the Unique Survey Project. These activities and their accompanying materials are suited for students in grades 7 through 9. These lessons make excellent sub plans. Each project takes approximately two 60-minute bl
Subjects:
Grades:
7th - 9th
Types:

Introduction to Functions | Unit with Videos
Each lesson in this Introduction to Functions Unit is taught via video with accompanying notes, practice, review, and assessments. This unit teaches the following concepts:* Graphing Relationships * Relations & Functions* Functional Notation * Graphing Linear Equations * Intercepts * Direct Variation * Scatter PlotsThis unit includes: * Video lessons that teach each concept in a way students can easily understand * Guided student notes that keep students engaged, hold them accountable, and s
Grades:
8th - 9th
Types:
CCSS:
Also included in: Algebra 1 Curriculum with Videos + ACTIVITIES Bundle
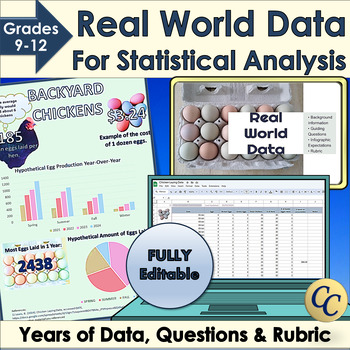
Real World Data for Statistical Analysis and Infographic Project
Give your students access to real world data for your statistical analysis unit or data literacy! Dive into statistics with Microsoft Excel™ or Google Sheets™ and years of data. Learn how to use standard deviation, mean or median to interpret data. Choose the best graphs to display conclusions in an infographic. Works great for science fairs! ✔ Includes an infographic project! (Template, expectations, and rubric). ✔ Everything is fully editable and you and your students can even use the images
Grades:
9th - 12th
Types:
CCSS:

The Vitruvian Man Investigation: scatterplots & linear equations
This investigation involves testing Da Vinci's theory of the ideal human proportions depicted by his famous work, The Vitruvian Man. In this two to three day activity, students must prove his theory as true or false by collecting data, graphing their data and then analyzing their results.
The structure of this activity allows for straight forward differentiation and can be used as a creating and interpreting scatterplots activity, or a higher level activity on graphing lines and finding the li
Grades:
6th - 9th
Types:
CCSS:
9th Grade Saxon Secondary 1 Math Powerpoints
These 120 Powerpoint lessons work hand in hand with the Saxon Algebra 1 math textbook. If you do not teach the Saxon program then these Powerpoints can be used to help teach the Secondary 1 Common Core. Each Powerpoint consists of a lesson overview which includes formulas and direct instructions. After that there are several practice problems that allows students to put into practice what they just learned. This is a great opportunity for group work as well as for the teacher to walk around the
Grades:
8th - 9th
Types:
CCSS:
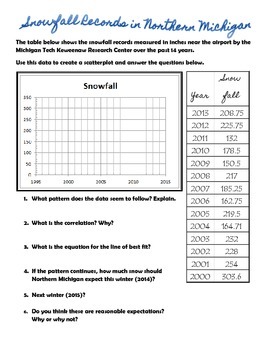
Scatter Plot Prediction Worksheet
This is a worksheet that uses snowfall data from Northern Michigan over the last 14 years. The students will create a scatter plot, determine the correlation, get a line of best fit, and predict two future values.
Subjects:
Grades:
9th - 12th
Types:
CCSS:

Snowfall – High School SBAC Math Performance Task (PT) Test Prep
The purpose of the Snowfall – SBAC Performance Task is to familiarize students with math performance tasks in preparation for standardized testing. This task has a multitude of applications. There are six versions of the task, each has the same context but different numbers. You can use these as class activities, proficiency practice, or quizzes. These tasks provide excellent practice for STARR testing and other state exams. This task gives students an opportunity to graph, evaluate and analyze
Subjects:
Grades:
8th - 10th
Types:
CCSS:
Also included in: Middle School SBAC Math Performance Task (PT) Test Prep Bundle
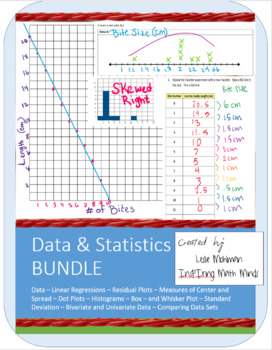
Bundle: Data and Statistics Unit and Twizzlers Project
This bundle includes a 5 lesson unit and a 5 part project.The project, students collect data, create graphs: scatterplots, dot plots, histograms, box-and-whisker plots. They analyze bivariate data by drawing lines of best fit, finding the correlation coefficient, linear regressions, and residual plots. They analyze univariate data looking at its shape (symmetric or skewed) and calculating the appropriate centers and spreads. With this fast and easy method of data collection, students each get
Subjects:
Grades:
7th - 12th
Types:
CCSS:
Showing 1-24 of 51 results


