23 results
Other (math) Common Core HSS-ID.B.6 resources
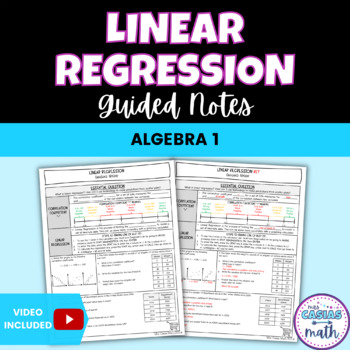
Linear Regression and Correlation Coefficient Guided Notes Lesson Algebra 1
This concise, to the point and no-prep linear regression lesson is a great way to teach & introduce how find the correlation coefficient and line of best fit with technology to your students. These notes go over the steps to using linear regression on a TI-84 calculator and include 3 in-depth examples with multiple parts where students find & interpret the correlation coefficient & line of best fit. Students and teachers love how easy these notes are to follow and understand. These n
Subjects:
Grades:
8th - 9th
CCSS:
Also included in: Linear Equations and Inequalities Algebra 1 Guided Notes Lessons BUNDLE
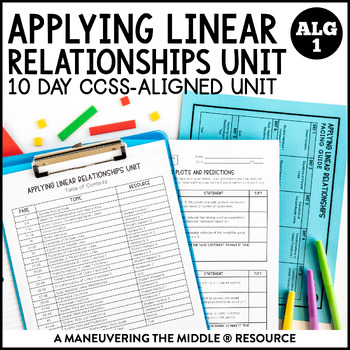
Applying Linear Relationships Unit | Parallel & Perpendicular Lines | Algebra 1
A 10-day Applying Linear Relationships CCSS-Aligned complete unit including concepts of applying linear relationships. Students will solve problems involving direct variation, write equations of parallel and perpendicular lines, describe transformations of linear functions, calculate the correlation coefficient of linear scatter plots and write equations for lines of best fit on a scatter plot.Students will practice with both skill-based problems, real-world application questions, and error anal
Subjects:
Grades:
8th - 9th
Types:
CCSS:
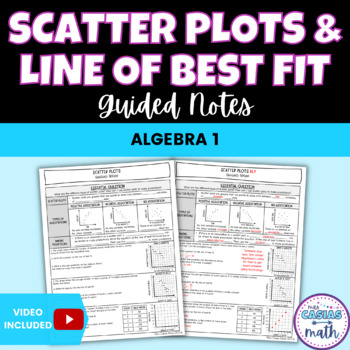
Scatter Plots and Line of Best Fit Guided Notes Lesson Algebra 1
This concise, to the point and no-prep scatter plots lesson is a great way to teach & introduce how to write the line of best fit to your students. These notes go over types of associations from scatter plots, and how to make predictions from scatter plots by writing the equation for the line of best fit without technology. There are 3 in-depth examples with multiple parts where students practice writing the line of best fit with two points from the line and use it to predict. Students and t
Subjects:
Grades:
8th - 9th
Also included in: Linear Equations and Inequalities Algebra 1 Guided Notes Lessons BUNDLE
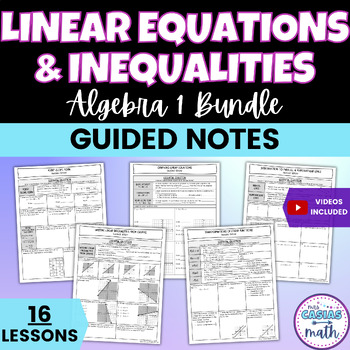
Linear Equations and Inequalities Algebra 1 Guided Notes Lessons BUNDLE
This bundle includes 16 different Algebra 1 lessons over linear equations and inequalities. These notes provide fantastic scaffolding by starting out with finding slope from linear equations in various forms, then move into point slope-form and standard form equations, parallel and perpendicular lines, linear inequalities, and end with scatter plots and linear regression. These lessons provide a variety of practice for students with simple skills-based problems all the way through real world app
Subjects:
Grades:
8th - 9th
CCSS:
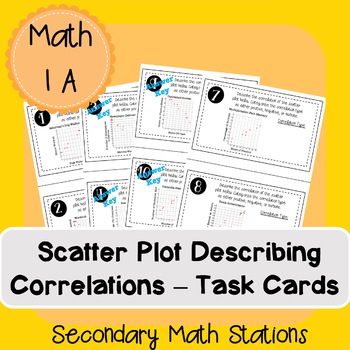
Scatter Plots -- Describing Correlations Task Cards
About this resource:This application practice has multiple uses in your classroom:Practice for an upcoming quiz or testComprehension CheckAdditional Practice during your "Activity" stationIntervention practice So much more!What topic(s) is/are covered?Scatter PlotsCorrelation types (positive, negative no/none)Describing Correlations (as x increases/decreases, y increases/decreases)Your answer key is included!How did you use this resource?I currently teach in the pull-out resource (POR) setting f
Subjects:
Grades:
6th - 10th
Types:
CCSS:
Also included in: Slope Applications Unit Activities Bundle!
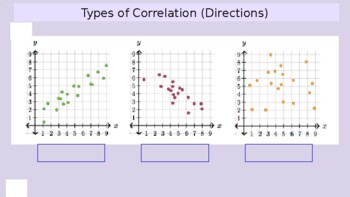
Correlation Coefficient Notes - Scale of r with accompanying scatter plot graphs
Clear notes about the correlation coefficient shown on a scale so students can see both strength, the scatter plot, and the direction all in one.
Subjects:
Grades:
6th - 9th
CCSS:
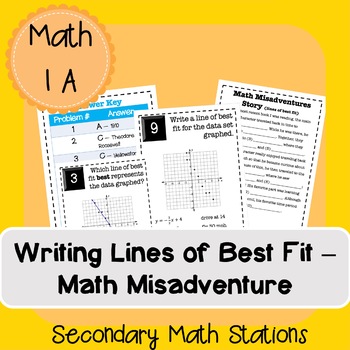
Writing Lines of Best Fit Math Misadventure (editable story)
About this resource:This application practice has multiple uses in your classroom:Practice for an upcoming quiz or testComprehension CheckAdditional Practice during your "Activity" stationIntervention practice So much more!What topic(s) is/are covered?Scatter PlotsLines of Best Fit (m/c and create your own)Your student answer space and answer key are included!How did you use this resource?I currently teach in the pull-out resource (POR) setting for an Algebra I course. This class is taught in a
Subjects:
Grades:
6th - 10th
Types:
CCSS:
Also included in: Slope Applications Unit Activities Bundle!

Ramp Racing: A Math Experiment with Slope & Function of Best Fit
This math experiment packs in a variety of algebra concepts! As students seek to find the ramp slope that will allow a matchbox car to travel the longest distance, they are required to make slope calculations, find averages, create a scatter plot, find a function of best fit, find a maximum value, and reflect on where the longest distance is seen on the graph. There are two different versions of the data analysis, written summary, and rubric: one for pre-algebra, and one for algebra.
Check ou
Subjects:
Grades:
8th - 10th
Types:
CCSS:
BUNDLE - Performance Task – Linear Functions – Player Efficiency Ratings
BUNDLE - Performance Task – Linear Functions – Player Efficiency Ratings
Now you can get more options and save money with this collection of all editions of Player Efficiency Ratings!
This set includes the Player Efficiency Ratings Performance Task in 30 different NBA teams’ editions. If you were to purchase each of these Performance Tasks individually, it would cost $120. At only $7, this bundle saves you about 94% off retail price!
In Player Efficiency Ratings Performance Task, students us
Subjects:
Grades:
9th - 12th
Types:
CCSS:
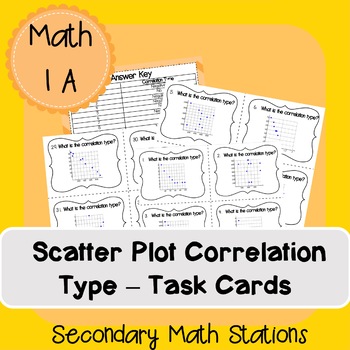
Scatter Plots -- Correlation Type Task Cards
About this resource:This application practice has multiple uses in your classroom:Practice for an upcoming quiz or testComprehension CheckAdditional Practice during your "Help with Friends" stationIntervention practice So much more!What topic(s) is/are covered?Scatter PlotsCorrelation types (positive, negative no/none)Your answer key is included!How did you use this resource?I currently teach in the pull-out resource (POR) setting for an Algebra I course. This class is taught in a block-schedule
Subjects:
Grades:
6th - 10th
Types:
CCSS:
Also included in: Slope Applications Unit Activities Bundle!
BUNDLE - Performance Tasks - Data Analysis - Red Versus Blue
BUNDLE - Performance Tasks - Data Analysis - Red Versus Blue
Now you can get more options and save money with this collection of all editions of Red Versus Blue!
This set includes the Red Versus Blue Performance Task in 4 different U.S. regions. If you were to purchase each of these Performance Tasks individually, it would cost $16. At only $7, this bundle saves you about 56% off retail price!
In the Red Versus Blue Performance Task, students use data from voter turnout to practice construct
Subjects:
Grades:
9th - 11th
Types:
CCSS:

Writing Lines of Best Fit - Matching Task Cards
About this resource:This application practice has multiple uses in your classroom:Practice for an upcoming quiz or testComprehension CheckAdditional Practice during your "Help with Friends" stationIntervention practice So much more!What topic(s) is/are covered?Scatter PlotsWriting Lines of Best FitYour answer key is included!How did you use this resource?I currently teach in the pull-out resource (POR) setting for an Algebra I course. This class is taught in a block-schedule period over the dura
Subjects:
Grades:
6th - 10th
Types:
CCSS:
Also included in: Slope Applications Unit Activities Bundle!
The Data Driven Teacher
Your classroom is full of data points of which you can be made aware. The purpose of this book is to set out the methods by which you, a teacher practitioner, can collect, analyze, and use data in the context of a teaching and learning environment. It focuses on helping you develop tools to model classroom data from the following components of the classroom: student relationshipsclassroom disciplineclassroom discoursecurriculum developmentassessment of masteryThe methods this book presents to
Grades:
Not Grade Specific
Types:
CCSS:

All of the Common Core Math Standards Checklists
This is a bundle of checklists for Math Common Core Standards for all of the grades (K-12) on an excel spreadsheet with 5 columns for data input. These standards are organized in their own sub-domains to coordinate lessons. Please see my free file for an example.
Subjects:
Grades:
K - 12th
Types:

BUNDLE - Performance Task – Scatterplots & Linear Functions – Commercial Slot
BUNDLE - Performance Task – Scatterplots and Linear Functions – Commercial Slot
Now you can get more options and save money with this collection of all editions of Commercial Slot!
This set includes the Commercial Slot Performance Task in 10 different TV series editions. If you were to purchase each of these Performance Tasks individually, it would cost $40. At only $7, this bundle saves you about 83% off retail price!
In the Commercial Slot Performance Task, students use authentic ratings d
Subjects:
Grades:
9th - 12th
Types:
CCSS:

BUNDLE - Performance Task – Linear Functions – Second Weekend Dropoff
BUNDLE - Performance Task – Linear Functions – Second Weekend Dropoff
Now you can get more options and save money with this collection of all editions of Second Weekend Dropoff!
This set includes the Second Weekend Dropoff Performance Task in 8 different movies editions. If you were to purchase each of these Performance Tasks individually, it would cost $32. At only $7, this bundle saves you about 78% off retail price!
In the Second Weekend Dropoff Performance Task, students use data from bo
Subjects:
Grades:
9th - 12th
Types:
CCSS:
BUNDLE - Performance Tasks - Correlations & Data Analysis - Voter Turnout
BUNDLE - Performance Tasks - Correlations & Data Analysis - Voter Turnout
Now you can get more options and save money with this collection of all editions of Voter Turnout!
This set includes the Voter Turnout Performance Task in 9 different state editions. If you were to purchase each of these Performance Tasks individually, it would cost $36. At only $7, this bundle saves you about 75% off retail price!
In the Voter Turnout Performance Task, students use data from voter turnout by state
Subjects:
Grades:
9th - 12th
Types:
CCSS:

Math Common Core Standards for 9th-12th Grade
This is a checklist for all of the Math Common Core Standards for ninth through twelfth grade on an excel spreadsheet with 5 columns for data input. These standards are organized in their own sub-domains to coordinate lessons. Please see my free file for an example.
Subjects:
Grades:
9th - 12th
Types:
CCSS:
Also included in: All of the Common Core Math Standards Checklists
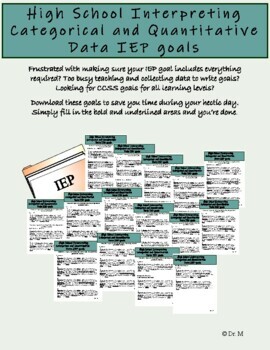
High School Interpreting Categorical and Quantitative Data IEP math goals
Do you feel frustrated and overwhelmed with everything on your plate? No need to sweat the small stuff. Relieve your current and future headaches with these premade IEP goals. There is no mixing and matching needed. This premade Interpreting Categorical and Quantitative Data IEP math goals packet is designed to save you valuable time, frustration, and headaches. Simply fill in the bold information to personalize each goal. This is a high school Interpreting Categorical and Quantitative Data IEP
Grades:
9th - 12th
Types:
CCSS:
Also included in: Algebra 1 IEP Math Goals
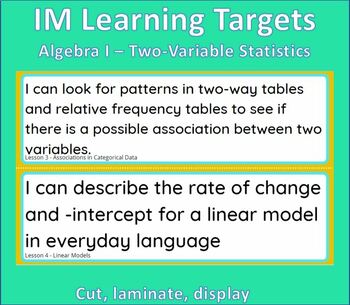
IM Learning Targets Algebra I Unit 3 - Two-Variable Statistics
Print, cut, laminate and then adhere to your objectives board in your classroom! Put magnets on the back for easy reuse.Each Learning target includes the lesson in IM that it corresponds to.Prints on legal paperCheck out the learning targets for other units6th Grade6.1 Area and Surface Area - FREE6.2 Introducing Ratios7th Grade7.1 Scale Drawings - FREE7.3 Measuring Circles7.4 Proportional Relationships and Percentages7.5 Rational Number Arithmetic7.6 Expressions, Equations, and Inequalities7.7 A
Subjects:
Grades:
8th - 9th
CCSS:
Also included in: IM Learning Targets Algebra I Bundle
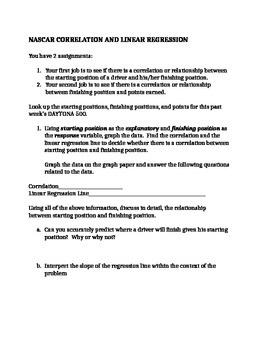
NASCAR Linear regression activity
Students will be looking at the correlation and the linear relationship between starting position and finishing position is a NASCAR race. They will also look at the correlation and relationship between finishing place and NASCAR points. Students will also interpret the slope of the the regression line in this activity.
This activity can be changed to use the most recent race results. You can let them look up the data on the internet or provide it for them.
Most of the time there will not be a
Subjects:
Grades:
11th - 12th
Types:
CCSS:
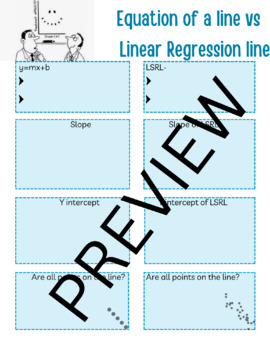
Equation of a Straight Line VS Linear Regression Line.
Equation of a Straight Line VS Linear Regression Line.Quick and easy way to make connections with what students know about a straight line and this new concept (Linear Regression)
Subjects:
Grades:
11th
CCSS:
Ohio Learning Standards (OLS) for Stats + 'I Can' Statements
Are you required to use the content standards on your lesson plans? And the 'I Can' statements? This product lists the 8 Mathematical Practices, an overview of the Statistics Learning Standards, and then the standards, each one accompanied by an 'I can' statement. The OLS are almost exactly the same as the Common Core State Standards, but for a little bit of the language and the notation. Oh, and this is FREE!
Grades:
10th - 12th
CCSS:
Showing 1-23 of 23 results


