17 results
Precalculus Common Core HSS-ID.B.6 resources
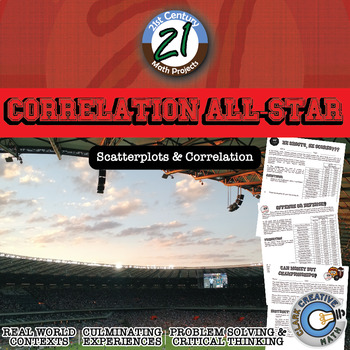
Correlation All-Star -- Sports Data Analysis - 21st Century Math Project
Bring an authentic sports-based math project to your Algebra, Algebra 2 or PreCalculus classroom with Lines of Best Fit and Correlations! All in this 21st Century Math Project! Using data from the MLB, NBA, NFL and NHL students investigate correlations to some of sports most common questions like: "Do more shots result in more goals?" "Do hitters or pitchers have more impact on a team's wins?""What NFL stat is most strongly correlated with wins?" and the grand-daddy..."Can money buy championship
Subjects:
Grades:
7th - 12th
Types:
CCSS:
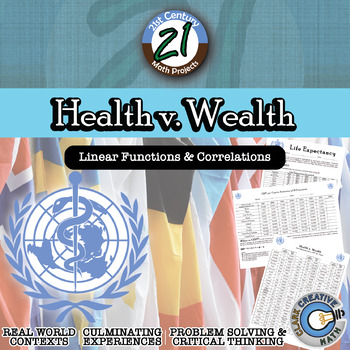
Health v. Wealth -- International Data & Correlation - 21st Century Math Project
Correlations and causation should be abundantly clear when students examine data of the Health and Wealth of over 80 nations around the world. The world is ever-changing and it is important for students to have a basic level of global awareness. In this 21st Century Math Project, students will use real world data to model regression functions, examine correlations and predict the future. In this project students will investigate global data sets to examine potential correlations related with the
Subjects:
Grades:
7th - 12th
Types:
CCSS:
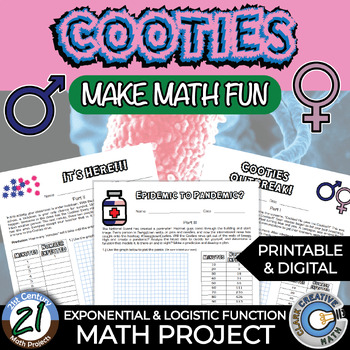
Cooties -- Pandemics -- Exponential & Logistic - 21st Century Math Project
It was an ordinary day. It was. Then came the screams, “Cooties! He gave me Cooties!!!” This was soon followed by “Cooties! She gave me Cooties!!!” Soon classes began to fall over (still breathing), but in an unconscious state. Bodies started turning blue and pink. A contagion was among them. The teachers, who have to receive Cooties immunizations to get their licensure, were left stunned.Turn your Algebra 2 or Pre-Calculus into a contagion command center with this 21st Century Math Project. Spe
Subjects:
Grades:
8th - 12th
Types:
CCSS:
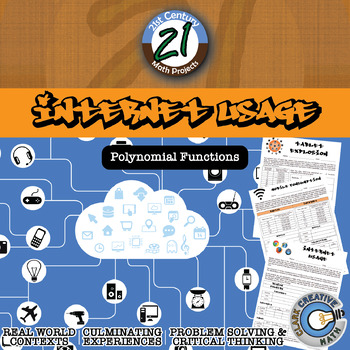
Internet Usage -- Intl Polynomial Regression - 21st Century Math Project
Experts believe that in the next twenty years the internet will be as integrated into our life as electricity. Today, the internet holds more information than you could read in 1,000 lifetimes. Today, there are 644 million active websites and that number is growing each day. In the United States, we may take for granted how easy it is to get on the internet. In different parts of the world this isn’t the case. Bring Internet Usage Statistics into your Algebra 2 / PreCalculus classroom with polyn
Subjects:
Grades:
8th - 12th
Types:
CCSS:
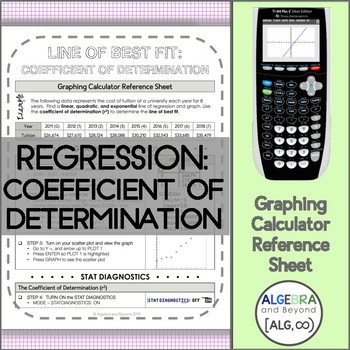
Linear, Quadratic, and Exponential and Coefficient of Determination | TI-84
This graphing calculator reference sheet shows students how to find the lines of regression for linear, quadratic, and exponential functions and determine the line of best fit using the coefficient of determination on the Ti-84 graphing calculator.Teaching graphing calculator skills to help students with: • Speed• Making connections• Checking for accuracy• Leaping hurdles*Reference sheets can be used with a TI-84 or Ti-83 graphing calculator. Please look at the preview to find out more informati
Subjects:
Grades:
9th - 12th
Types:
CCSS:
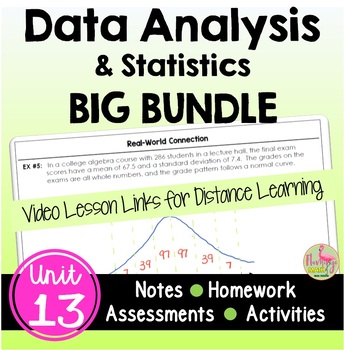
Data Analysis BIG Bundle (Algebra 2 - Unit 13)
This is a BIG Bundle of GUIDED NOTES WITH GOOGLE SLIDES and VIDEO LESSONS for your distance learning needs, homework, daily warm-up, content quizzes, mid-unit and end-unit assessments, review assignments, and cooperative activities for Algebra 2 Honors UNIT 13: DATA ANALYSIS & STATISTICS. #distancelearningtptWhat is included in each lesson?The unit is organized into SIX lessons, that will take approximately 15 instructional days.⭐ Guided Student Notes⭐ 8-Page Bound-Book Style Foldable⭐ GOOGL
Subjects:
Grades:
8th - 11th, Higher Education
CCSS:
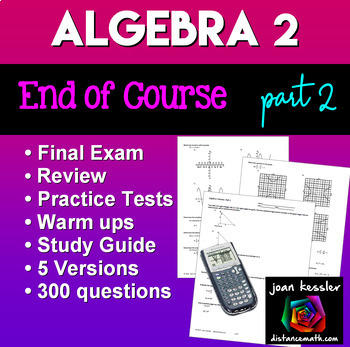
Algebra 2 Final Exam or Review Packet Part 2
This Algebra 2 - Part 2 Review can be used as a Final Exam, or Warm Ups and includes 300 Questions in 5 Versions. It can also be used as a Pretest or review for many topics in PreCalculus. Since Algebra 2 Curriculum differs between schools, I have created this to supplement Algebra 2 End of Course Reviews with 250 Questions Part 1 with topics found in many Algebra 2 curricula, especially those that are Common Core or similar.TOPICS INCLUDE • Conics: Circles, Ellipses, Hyperbolas, Parabolas
Subjects:
Grades:
9th - 12th
Types:
CCSS:
Also included in: Algebra 2 EOC Review or Exam Bundle
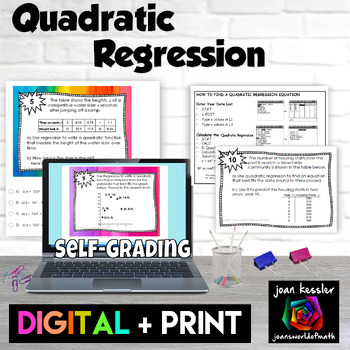
Quadratic Regression Applications Digital plus Print Activity plus TI-84 notes
This Quadratic Regression activity is a great way for your students to practice their skills finding the quadratic equation of best fit. There are 12 problems with both digital and printable PDF versions included. Questions include: Projecting TrendsFind the quadratic regression from a tableFind the quadratic regression from a scatter plotDetermining the R² coefficientApplications The editable digital self checking version can be used as an Quiz, HW, or Paperless worksheet and is designed with
Subjects:
Grades:
9th - 12th
Types:
CCSS:
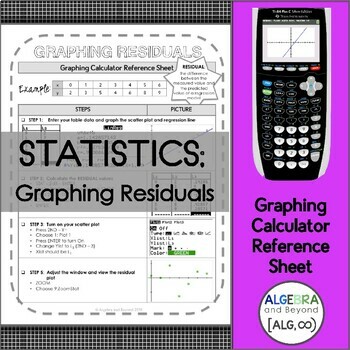
Residuals | Statistics | TI-84 Graphing Calculator Reference Sheet
This graphing calculator reference sheet guides students step by step with visuals on how to graph residual plots.*Important: this sheet does NOT teach them how to graph a scatter plot or a line of regression. If students need these steps, please also purchase the Linear Regression graphing calculator reference sheet to accompany the residual sheet.Teaching graphing calculator skills to help students with: • Speed• Making connections• Checking for accuracy• Leaping hurdles*Reference sheets can b
Subjects:
Grades:
10th - 12th
Types:
CCSS:
Power, Polynomial & Radical Functions Unit Bundle - Distance Learning Compatible
This is a selection of my Power, Polynomial & Radical Functions resources all in a money saving Essential Bundle! You save significant money and time versus purchasing these separately!Essential Bundles are designed to give you everything you need to rock your unit. Warmups, Notes, Activities, Games, Exit Tickets, and Tests. You will find a selection of my Drive Instruction, Escapes, Boot Camp, Adventures, Whodunnits, CSI, Person Puzzles, STEM-ersions, Herowork, TableTop and my 21st Century
Subjects:
Grades:
9th - 12th
Types:
CCSS:
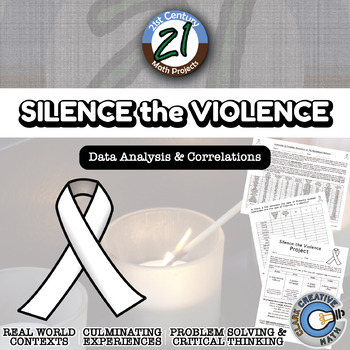
Silence the Violence -- International Data Analysis - 21st Century Math Project
Silence the Violence intends to take a closer look at gun violence throughout the world. Is there a correlation between gun ownership and gun violence? While this is on the news, and people argue back and forth, unfortunately there are not a lot of statistics cited.I built this project through the use of correlations of authentic international data. I have included content for either middle school (plotting and calculating) or high school (calculating correlation with summations). The results ar
Subjects:
Grades:
6th - 12th
Types:
CCSS:
Statistics Fantasy Football Project
High School and Middle School Statistics Class Project. Fantasy Football is played by an estimated 25 to 30 million people each year and in this project our students will be part of the action! Don't worry, if you don't know one thing about football you will do fine with this project! Each student will become an owner and draft their own players for different positions. Each owner must draft on quarterback, one running back, two wide receivers, and one tight end and keep track of their stats
Subjects:
Grades:
7th - 12th, Higher Education
Types:
CCSS:

Scatter Plots, Income Inequality, and The Gatsby Curve
This bundle includes a student copy and Teacher Guide/answer key.In this three-part activity, students are introduced to two statistics used to describe economies: the Gini Coefficient (measuring income inequality) and Intergenerational Earnings Elasticity (IEE, measuring social mobility from generation to generation.) The activity revolves around scatter plots of Gini Coefficient vs. IEE.In part 1, focusing on placing/locating points on a scatter plot, students match verbal descriptions of fict
Subjects:
Grades:
9th - 12th
CCSS:
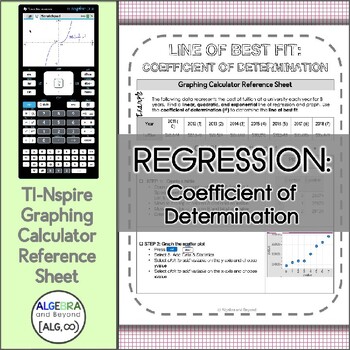
Linear, Quadratic, and Exponential and Coefficient of Determination | TI-Nspire
This graphing calculator reference sheet shows students how to find the lines of regression for linear, quadratic, and exponential functions and determine the line of best fit using the coefficient of determination on the Ti-84 graphing calculator.Teaching graphing calculator skills to help students with: • Speed• Making connections• Checking for accuracy• Leaping hurdles*Reference sheets can be used with a TI-Nspire graphing calculator. Please look at the preview to find out more information ab
Subjects:
Grades:
9th - 12th
Types:
CCSS:
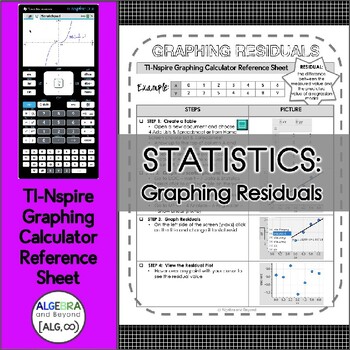
Residuals | Statistics | TI-Nspire Graphing Calculator Reference Sheet
This graphing calculator reference sheet guides students step by step with visuals on how to graph residual plots.Teaching graphing calculator skills to help students with: • Speed• Making connections• Checking for accuracy• Leaping hurdles*Reference sheets can be used with a TI-Nspire graphing calculator. Please look at the preview to find out more information about this resource.∞∞∞∞∞∞∞∞∞∞∞∞∞∞∞∞∞∞∞∞∞∞∞∞∞∞∞∞∞∞∞∞∞∞∞∞∞∞∞∞∞∞∞∞∞∞∞© Algebra and Beyond This product is intended for personal use in one
Subjects:
Grades:
10th - 12th
Types:
CCSS:
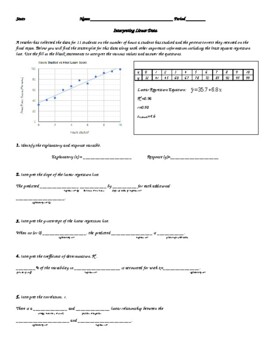
Statistics: Interpreting Linear Data Worksheet
Students will use the information given in the scenario of Hours Studied vs Final Exam Score to interpret statistical measures like correlation, coefficient of determination, the standard deviation of residuals, residuals, and slope and y-intercept of the least-squares regression line. They will use the fill-in-the-blank models to help them interpret these measures. Editable worksheet.
Subjects:
Grades:
9th - 12th
Types:
CCSS:

Quadratic Regressions Exploration
Students apply their knowledge of quadratic functions to create and analyze a regression equation of a data set.
Subjects:
Grades:
10th - 12th
Types:
CCSS:
Showing 1-17 of 17 results


