30 results
Adult education Common Core HSS-ID.B.6 resources
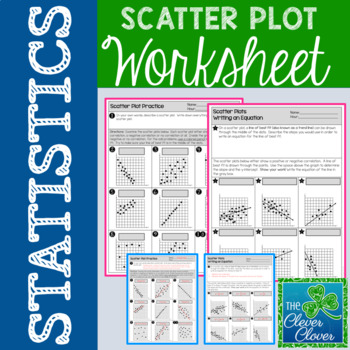
Scatter Plot Worksheet
Scatter Plot Worksheet
This resource allows students to explore scatterplots with a two page worksheet. Students are asked to define scatterplots in their own words. Nine questions ask students to identify the type of correlation (positive, negative or no correlation) that exists between two variables. Students are also asked to describe the steps used to write an equation for the line of best fit. Six additional questions require students to calculate the slope and determine the y-intercept
Subjects:
Grades:
6th - 9th, Adult Education
Types:
CCSS:
Also included in: Scatter Plot Mini-Bundle
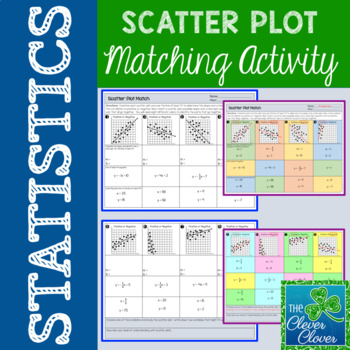
Scatter Plot Matching Activity
Scatter Plot Matching Activity
This resource allows students practice with scatter plots. Students will examine eight scatter plots. With each scatter plot, they will do the following:
✓ Identify if the scatter plot shows a positive or negative correlation
✓ Calculate the slope and determine the y-intercept
✓ Write the line of best fit equation
✓ Match a scatter plot, slope & intercept, line of best fit equation and possible coordinate pair
Students are asked to think of two variables t
Subjects:
Grades:
6th - 9th, Adult Education
Types:
CCSS:
Also included in: Scatter Plot Mini-Bundle
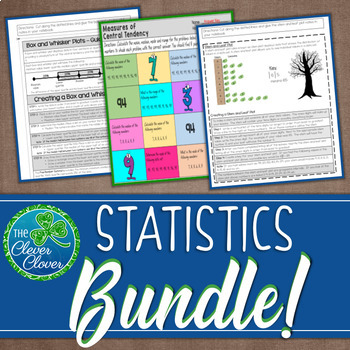
Statistics Bundle - Guided Notes, Worksheets & Scavenger Hunts!
Are your kids studying the measures of central tendency, box and whisker plots, stem and leaf plots, two-way tables, histograms and scatter plots? This valuable resource includes guided notes, worksheets, scavenger hunts, assessments and more that you can use for your statistics unit. Below you will find a brief description and link of each resource.
Measures of Central Tendency - Guided Notes, Worksheets and Scavenger Hunts
This resource includes guided notes, practice worksheets and two scave
Subjects:
Grades:
6th - 9th, Adult Education
CCSS:
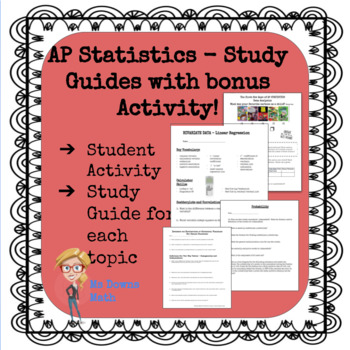
AP Statistics Study Guides - All Topics!
There is a pdf file study guide for each topic in the AP Statistics curriculum. Exploring Data, Normal Distributions, Linear Regressions, Experiments and Designing Studies, Probability, Random Variables, Sampling Distributions, Confidence Intervals, Hypothesis Tests, Comparing Populations, Chi Square Procedures, and Inference about Regression. I have students complete one for each unit. At the end of the year, they have a great study packet for the AP Exam! Student feedback has indicated that th
Subjects:
Grades:
9th - 12th, Higher Education, Adult Education
Types:
CCSS:
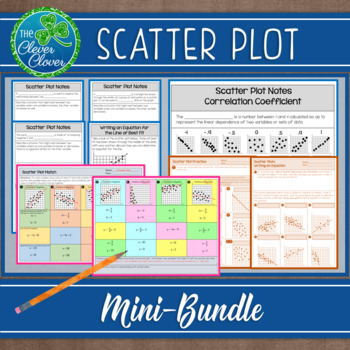
Scatter Plot Mini-Bundle
This resource includes six half pages of notes that are perfect for interactive notebooks. The first three pages introduce students to positive, negative and no correlation scatter plots. Students are asked to describe real world situations that might exist for each type of correlation. Students will graph three different sets of data in order to visualize the different types of scatterplots. Definitions for the line of best fit and correlation coefficient are provided. Each one of the half p
Subjects:
Grades:
6th - 9th, Adult Education
CCSS:
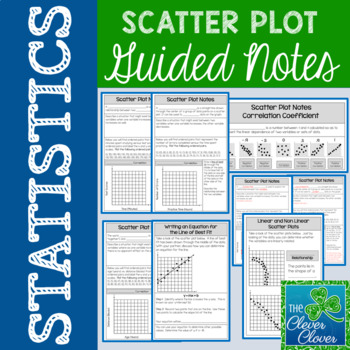
Scatter Plot Notes
This resource includes six half pages of notes that are perfect for interactive notebooks. The first three pages introduce students to positive, negative or no correlation scatter plots. Students are asked to describe real world situations that might exist for each type of correlation. Students will graph three different sets of data in order to visualize the different types of scatterplots. Definitions for the line of best fit and correlation coefficient are provided. Each one of the half pa
Subjects:
Grades:
6th - 9th, Adult Education
Types:
CCSS:
Also included in: Scatter Plot Mini-Bundle
TI-84 Plus Graphing Calculator Training
Learn the features of the Texas Instruments TI-83 Plus Graphing Calculator.This resource contains 16 handouts with examples, directions, screenshots, keystrokes and extra practice (with answer keys) for 16 topics:Solving EquationsCreating GraphsScatterplotsTable FeaturesList FeaturesRegression EquationsMatrix EquationsTransforming GraphsEvaluating FunctionsResidualsGraphing Piecewise FunctionsAnalyze FunctionsOne Variable StatisticsStoring FeaturesCreating PolygonsGraphing InequalitiesUse this r
Grades:
7th - 12th, Higher Education, Adult Education
CCSS:
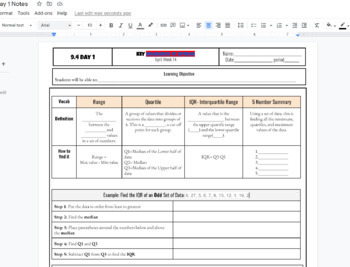
IQR interquartile Range and 5 number summary box and whisker plot Notes
IQR interquartile Range and 5 number summary box and whisker plot Notes including Q1, Q2, Q3, Min and Max and step by step both examples of finding the IQR and creating a box and whisker plot. Used in HS math 1 class WITH KEY INCLUDED AS a link to a printable PDF
Subjects:
Grades:
7th - 12th, Higher Education, Adult Education
CCSS:
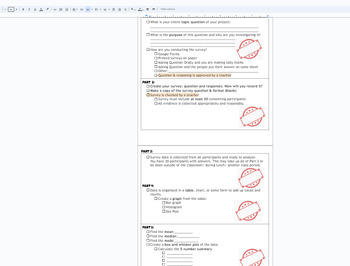
Statistics Survey project Discovery (broken down into sections) with Rubric
This is a broken down (scaffolded) packet of instructions/ guide for a Stats Project for Math 1 HS or 8th grade students. The goal of the project is for students to take a statistical survey on quantitative data (numbers) of their choice. Using this data from the survey, the following will be included in the project:Survey- the question being askedSurvey responses (requirement of 30)Data organization: Bar chart, Histogram, Dot PlotMeanMedianModeBox and Whisket Plot5 number summary (Q1,Q2,Q3, min
Subjects:
Grades:
7th - 12th, Higher Education, Adult Education
CCSS:
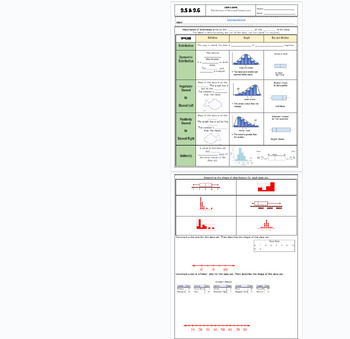
Data Distribution positive/negative skewed fillable notes UPDATED
Unit 9: Data and Stats: Updated(No 9.3/ Skip)9.5/9.6 Data Distribution (skewness)Students go over the vocabulary and complete the examples with the vocabulary scaffolded. Skewness is explained and how to identify it comparing data charts and box and whisker plots. Uses many visuals and examples to differentiate between that different graphs. Notes are scaffolded. Includes hook video hyperlinked on the "learning objective" title. Key is included and hyperlinked as a PDF in the heading highlighted
Subjects:
Grades:
6th - 12th, Higher Education, Adult Education
CCSS:
Also included in: Unit 9: Data and Statistics Fillable Notes

Unit 9: Data and Statistics Fillable Notes
Unit 9: Data and Stats(No 9.3/ Skip)9.1 Central Tendencies: Mean, Median and Mode9.2 Graphical Data: Bar Charts, Dot Plots and Histograms9.3 NONE9.4A 5 number summary and box and whisker plots 9.4B Standard Deviation9.5/9.6 Data Distributions (skewness) left or right9.7 Frequency Tables and relative frequency tablesStudents go over the vocabulary and complete the examples with the vocabulary scaffolded. Notes are scaffolded. Includes hook video hyperlinked on the "learning objective" title. Key
Subjects:
Grades:
6th - 12th, Higher Education, Adult Education
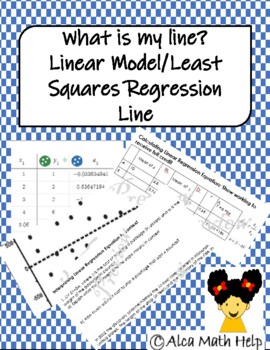
Least Squares Regression Line: What is my line?
At the end of this activity Students will be able to:Examine the residual values and determine the prediction the model made. Examine residual plots to determine the appropriateness in models.Calculate and interpret slope and y-intercept in contextEstimate the strength and relationship between variables using a scatterplot.Explain the difference between correlation and causationAnswer Key not included!This activity sheet can be used as a Unit Quiz, Classwork or HomeworkIt comprises of short answ
Subjects:
Grades:
9th - 12th, Higher Education, Adult Education, Staff
Types:
CCSS:
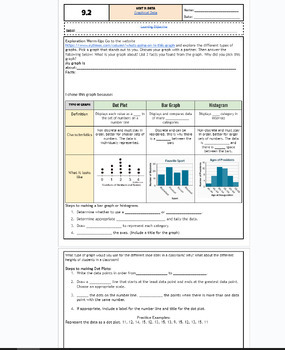
Graphical Data: Bar Charts, Dot Plots and Histograms fillable notes UPDTD
Unit 9: Data and Stats: UpdatedUpdated9.2 Graphs: bar, dot plot, histpgramStudents go over the vocabulary and define each type fo graph and what data fits for each graph. The warm up is an exploratory activity where students go on a website to search for their graph of interest and discuss the key findings. This takes around 10-15 mins and students enjoyed it! Notes are scaffolded. Includes hook video hyperlinked on the "learning objective" title. Key is included and hyperlinked as a PDF in the
Subjects:
Grades:
6th - 12th, Higher Education, Adult Education
CCSS:
Also included in: Unit 9: Data and Statistics Fillable Notes
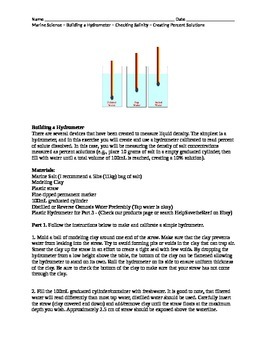
Marine Science Biology Making a Hydrometer Making Percent Solutions
This laboratory experience enables students to create a hydrometer using clay and straws to measure unknown solutions. Students begin by calibrating their devices using percent solutions that they must make. They can then use their device to measure unknown solutions provided by the instructor. Students are asked to convert units of measure. Additional research questions are provided that go beyond the laboratory activity.
Subjects:
Grades:
9th - 12th, Adult Education
Types:
CCSS:
Graphing in Science: A Google Slides Lesson PLUS Guided Notes Handout!
This EDITABLE Google slides (powerpoint) presentation AND guided notes handout covers all of the essential information students need to create and analyze graphs in science. This lesson is designed to refresh students on the concepts of creating graphs using scientific data, analyzing relationships between independent and dependent variables, and includes lots of examples and practice opportunities! This lesson can be used to introduce the important concepts of graphing in science, or it can be
Subjects:
Grades:
5th - 12th, Higher Education, Adult Education
CCSS:
Also included in: Introduction to Science: Unit Bundle! No Prep Required!
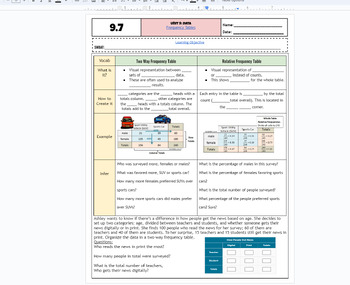
Frequency Tables & Relative Frequency Tables fillable notes UPDATED
Unit 9: Data and Stats: Updated(No 9.3/ Skip)9.7 Frequency Tables Students go over the vocabulary and complete the examples with the vocabulary scaffolded. Students examine a categorical table/frequency table and also use that information to create relative frequency tables. Different real-world examples and problems are used. Emphasized how percents and decimals are calculated. Notes are scaffolded. Includes hook video hyperlinked on the "learning objective" title. Key is included and hyperli
Subjects:
Grades:
6th - 12th, Higher Education, Adult Education
CCSS:
Also included in: Unit 9: Data and Statistics Fillable Notes
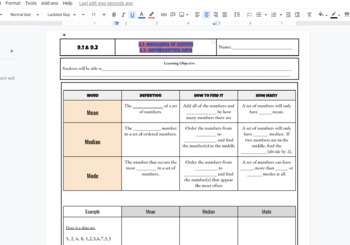
Mean, Median, Mode and Dot plot, bar graph histogram Fillable Notes Scaffolded
Central Tendencies: Mean, Median and Mode Fillable Notes Scaffolded used in math 1 classroom to introduce the data unit. Also includes dot plot, histogram and bar chart lesson. KEY IS INCLUDED!
Subjects:
Grades:
7th - 12th, Higher Education, Adult Education
CCSS:
Algebra 1 - Common Core Practice Final Exam - Google Form #1 (45 Questions)
Hello! The purchase of this product grants the purchase of one (1) DIGITAL (Google Forms) self-grading assessments, which is a practice final exam that has a mix of forty-five (45) multiple-choice & fill-in-the-blank questions on Algebra 1 - 1st Semester Common Core Curriculum.Goals Of This Assessment: Students will be able to:Simplify or identify equivalent algebraic expressions. Represent math relationships using symbolic algebra. Differentiate between linear and nonlinear functions. Model
Subjects:
Grades:
6th - 12th, Higher Education, Adult Education
Types:
CCSS:
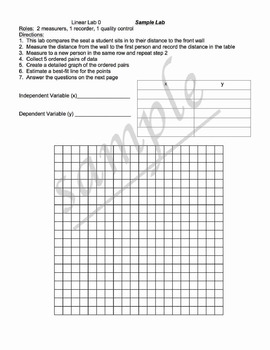
Linear Relationship Labs
This project has 1 sample lab to complete together as a class and 6 other labs that create a linear relationship.
Students work through the labs collecting data and then analyze the data to create equations, use calculators or spreadsheets to create regression equations (best fit lines), and use the equations to make predictions.
classes: algebra 1, geometry, algebra 2, applied math
Here are links to my other algebra projects:
Click Here to see my project: Systems of Equations - Comparing Ph
Subjects:
Grades:
7th - 12th, Higher Education, Adult Education
Types:
CCSS:
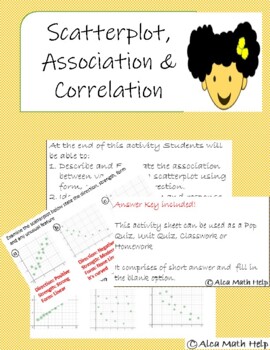
Scatterplot, Association & Correlation
This activity is design as a practice sheet: bell work, pop quiz, classwork or homework or mini quiz. It aims to extend students understanding of scatterplot, association and correlation Students can work collaboratively or independently. Very effective with low level learners and a good kick start for higher learners as this will boost their confidence level. At the end of this activity Students will be able to:1.Describe and Estimate the association between variables of a scatterplot using for
Subjects:
Grades:
8th - 12th, Adult Education
Types:
CCSS:
Math Project Scatter Plots: Are You Really Going to Eat That? *DISTANCE LEARNING
PRINT and DIGITAL * * Makes distance planning so much easier!Math Project Scatter Plots: Are You Really Going to Eat That? This math project is a fun way for your students to use bivariate data that is highly engaging and relevant to them to construct scatter plots in a real-world situation! Your students will enjoy making choices about restaurants and meals they like to eat based on their personal needs and wishes. Students will organize the nutrition data of the meals they choose using tables
Subjects:
Grades:
7th - 10th, Adult Education
CCSS:
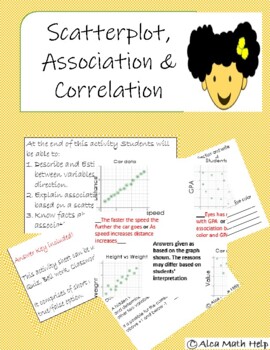
Scatterplot Association
This activity is design as a practice sheet: bell work, pop quiz, classwork or homework. It aims to extend students understanding of scatterplot, association and correlation Students can work collaboratively or independently. Very effective with low level learners and a good kick start for higher learners as this will boost their confidence level.At the end of this activity Students will be able to:1.Describe and Estimate the association between variables of a scatterplot using direction.2.Expla
Subjects:
Grades:
8th - 12th, Adult Education
Types:
CCSS:
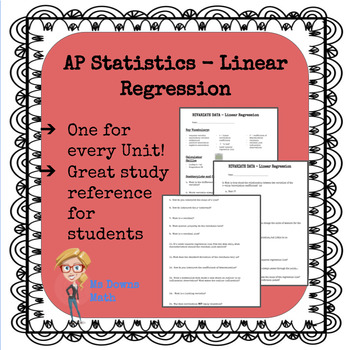
AP Statistics Linear Regression Study Guide
At the beginning of each unit, I give my students a study guide that is due the day of the unit test. These guides are a good way to prepare for the unit as we go. At the end of the year students have a nice reference book for the whole course!
Subjects:
Grades:
9th - 12th, Higher Education, Adult Education
Types:
CCSS:
Also included in: AP Statistics Study Guides - All Topics!
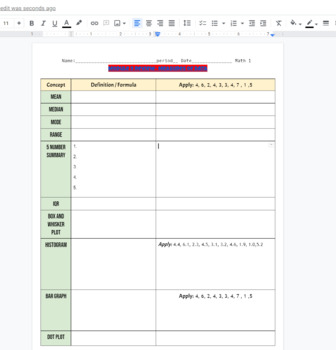
Measures of Data review sheet/ study guide, Mean, median, mode, st. deviation
I use this in my class as a review for Module 9 which is the Measures of Data review sheet/ study guide, Mean, median, mode, standard deviation, 5 number summary, skewed left, right, histogram, box plot, dot plot, bar graphs. This is used as a study guide where students can write out their formula or definition and apply it in the same column. 100 percent editable WITH KEY INCLUDED. This can be a homework assignment, cheat sheet, pre-assessment or post-assessment on a chapter in Math 1 HS course
Subjects:
Grades:
6th - 12th, Higher Education, Adult Education
Types:
CCSS:
Showing 1-24 of 30 results

