64 results
6th grade Common Core HSS-ID.B.6 resources
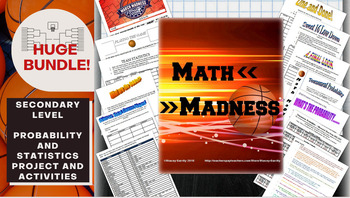
Math March Madness Full Tournament Project {BUNDLE}
Harness the excitement of NCAA March Madness with this huge project for secondary math teachers that follows all stages of the tournament! This Common Core aligned bundle comes with bonus parts not sold individually in my store so you can create a rich immersion in the tournament, practice probability and statistics and learn some interesting new ones along the way! Save $3 plus get bonus content by bundling!You can pick and choose which parts you would like to incorporate, or follow my schedu
Subjects:
Grades:
6th - 12th, Higher Education
Types:
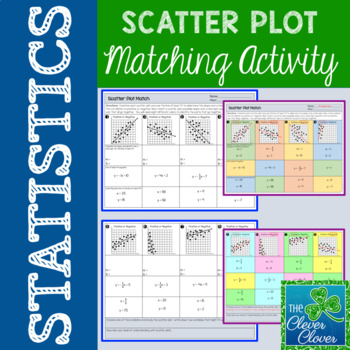
Scatter Plot Matching Activity
Scatter Plot Matching Activity
This resource allows students practice with scatter plots. Students will examine eight scatter plots. With each scatter plot, they will do the following:
✓ Identify if the scatter plot shows a positive or negative correlation
✓ Calculate the slope and determine the y-intercept
✓ Write the line of best fit equation
✓ Match a scatter plot, slope & intercept, line of best fit equation and possible coordinate pair
Students are asked to think of two variables t
Subjects:
Grades:
6th - 9th, Adult Education
Types:
CCSS:
Also included in: Scatter Plot Mini-Bundle
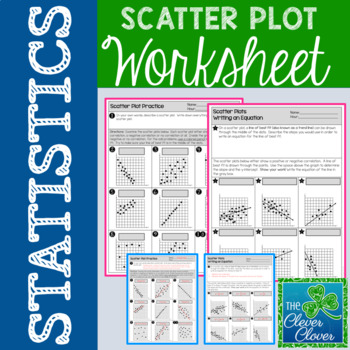
Scatter Plot Worksheet
Scatter Plot Worksheet
This resource allows students to explore scatterplots with a two page worksheet. Students are asked to define scatterplots in their own words. Nine questions ask students to identify the type of correlation (positive, negative or no correlation) that exists between two variables. Students are also asked to describe the steps used to write an equation for the line of best fit. Six additional questions require students to calculate the slope and determine the y-intercept
Subjects:
Grades:
6th - 9th, Adult Education
Types:
CCSS:
Also included in: Scatter Plot Mini-Bundle
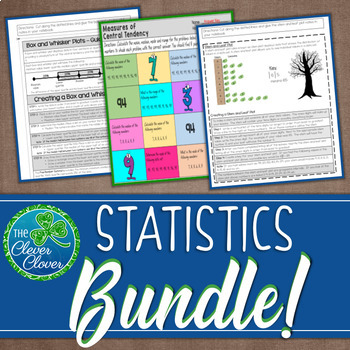
Statistics Bundle - Guided Notes, Worksheets & Scavenger Hunts!
Are your kids studying the measures of central tendency, box and whisker plots, stem and leaf plots, two-way tables, histograms and scatter plots? This valuable resource includes guided notes, worksheets, scavenger hunts, assessments and more that you can use for your statistics unit. Below you will find a brief description and link of each resource.
Measures of Central Tendency - Guided Notes, Worksheets and Scavenger Hunts
This resource includes guided notes, practice worksheets and two scave
Subjects:
Grades:
6th - 9th, Adult Education
CCSS:
Gridiron Glory -- "Big Game" Data & Paper Football - 21st Century Math Project
I have heard that Americans like Football. I have also heard about an important game that happens in February. I have heard that it's a day that nachos dread. In this 21st Century Math Project, students will complete a variety Football-based assignments related to the Statistics strands of the Common Core. The project caps off with a Paper Football tournament that asks students to use expected value to guide their decisions!This product includes 3 prep assignments that reaches a variety of learn
Subjects:
Grades:
6th - 12th
Types:
CCSS:
Also included in: Probability & Expected Value Unit Bundle - Distance Learning Compatible

42 Blank Graph Templates: Horizontal & Vertical Bar Graph, Line Graph, Printable
Looking for an array of printable graph templates for all your future bar and line graph needs? Look no further! With 42 different templates ranging for bar graphs, to line graphs, varying in X values and Y values, this combination should be the last graph download you need to worry about for your class. These graphs can even be used as Histograms, Dot Plots, Scatter Plots, or a variety of other graphs to suit the needs of your classroom.I created this template to require all the basics of gr
Grades:
4th - 12th
Types:
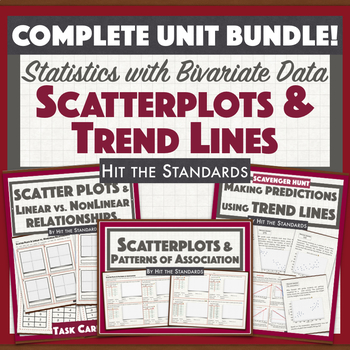
Statistics with Bivariate Data: Scatterplots & Trend Lines UNIT 6 BUNDLE 30% OFF
This unit bundles students expectations that address representing bivariates sets of data with scatterplots and representations of linear situations like constructing scatterplots and use them to describe the association of the data, constructing and using trend lines to make predictions and interpreting the slope of the line as the unit rate of the relationship, contrasting between linear proportional, linear not proportional and not linear relationships. The bundle includes worksheets, task ca
Subjects:
Grades:
6th - 9th
Types:
CCSS:

Statistics Survey Project - Project Based Learning (PBL) with Math
Watch your students dive into the world of math as they create, execute, and analyze their own survey! Students will demonstrate mastery of data gathering, survey sampling, developing appropriate survey questions, data tables, Direct Variation, discrete graphs, dot plots, box and whisker graphs, and calculating the inter-quartile range.The Unique Survey Project is highly engaging, capitalizing on the innate curiosity of the adolescent mind. You will love the low-prep instructional guide. Your st
Subjects:
Grades:
6th - 10th
Types:
Also included in: Fun with Ratios Activities Bundle - 7th Grade PBL with Math
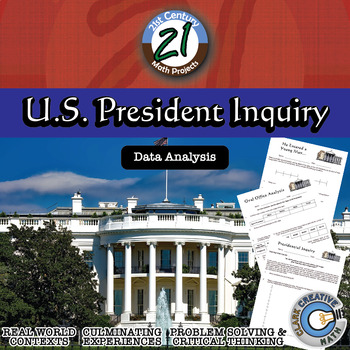
U.S. President -- Data Analysis & Statistics Inquiry - 21st Century Math Project
Engage students in data analysis through use of Presidential data in this 21st Century Math Project. Students will create box and whisker, stem and leaf, histograms and scatterplot through their investigations. In the end, students will take on the inquiry question: "Do US Presidents with the most children live longer after they have been inaugurated?" ***THIS PRODUCT HAS BEEN UPDATED WITH A GOOGLE SLIDES INTERACTIVE VERSION INCLUDED. REDOWNLOAD IF YOU HAVE IT ALREADY***-- In "He Entered a Youn
Subjects:
Grades:
6th - 12th
Types:
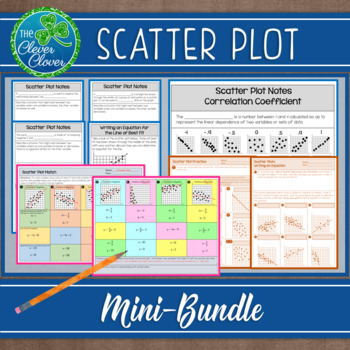
Scatter Plot Mini-Bundle
This resource includes six half pages of notes that are perfect for interactive notebooks. The first three pages introduce students to positive, negative and no correlation scatter plots. Students are asked to describe real world situations that might exist for each type of correlation. Students will graph three different sets of data in order to visualize the different types of scatterplots. Definitions for the line of best fit and correlation coefficient are provided. Each one of the half p
Subjects:
Grades:
6th - 9th, Adult Education
CCSS:
Measures of Center & Variance Unit Bundle - Distance Learning Compatible
This is a selection of my Measures of Center & Variance resources all in a money saving Essential Bundle! You save significant money and time versus purchasing these separately!Essential Bundles are designed to give you everything you need to rock your unit. Warmups, Notes, Activities, Games, Exit Tickets, and Tests. You will find a selection of my Drive Instruction, Escapes, Boot Camp, Adventures, Whodunnits, CSI, Person Puzzles, STEM-ersions, Herowork, TableTop and my 21st Century Math Pro
Subjects:
Grades:
6th - 12th
Types:
Scatter Plot Notes
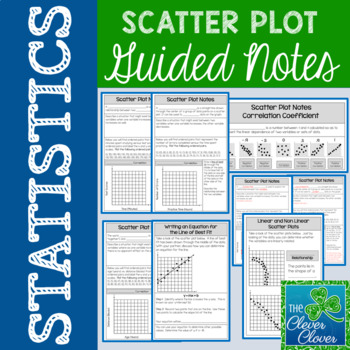
This resource includes six half pages of notes that are perfect for interactive notebooks. The first three pages introduce students to positive, negative or no correlation scatter plots. Students are asked to describe real world situations that might exist for each type of correlation. Students will graph three different sets of data in order to visualize the different types of scatterplots. Definitions for the line of best fit and correlation coefficient are provided. Each one of the half pa
Subjects:
Grades:
6th - 9th, Adult Education
Types:
CCSS:
Also included in: Scatter Plot Mini-Bundle
Constructing Scatter Plots Digital Notes & 2 Quizzes (GOOGLE) (Distance Learning
Product DescriptionGoogle Slides Digital Interactive Notes. The notes are everything beneficial of an interactive notebook without all the paper, glue, scissors, etc.Content:Students will be able to construct scatter plots given a set of data. Students will be able to identify positive correlation, negative correlation, and no correlation. Includes:Google Slides: Constructing Scatter Plots Digital NotesGoogle Forms: Self Grading Quick Check Quiz 1 & Self Grading Quick Check Quiz 2Answer KeyT
Subjects:
Grades:
6th - 9th
Types:
CCSS:
Also included in: 8th Grade Math Digital Notes GROWING BUNDLE (Distance Learning)
Scatter Plot Review, Study Guide, Test - Algebra - No Prep
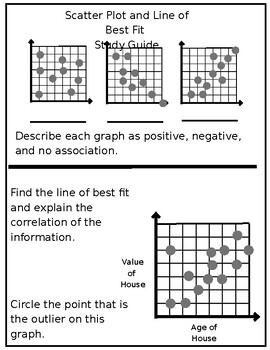
Introducing our comprehensive Scatterplot and Line of Best Fit Study Guide, Test, and Review Activity, designed specifically for teachers and their Algebra 1 and 2 students. This educational resource is ideal for teaching the key concept of scatterplot points.The study guide offers a concise yet comprehensive overview of scatterplots, emphasizing data interpretation and the process of drawing a line of best fit. Students will receive step-by-step guidance on creating accurate scatterplots and co
Subjects:
Grades:
6th - 12th
CCSS:
Pet Rock Statistics Activity & Task - Project Based Learning (PBL) with Math
Statistics come alive with this differentiated, student-led activity! The Pet Rock Activity & Task gives students an opportunity to gather, organize, and analyze random data. Students get creative while personalizing their own Pet Rock. Data from individual rocks is then measure, shared, compiled, analyzed, graphed, and displayed. Students will:Create a pet in the Pet Rock Activity.Use precision to weigh the rocks and record the data.Construct a graphical display of the data.Calculate numeri
Subjects:
Grades:
6th - 10th
Types:
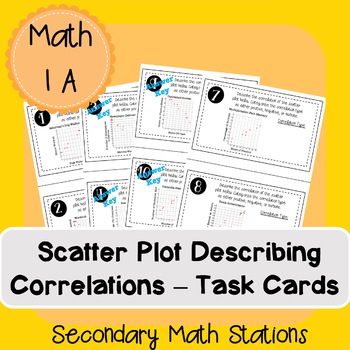
Scatter Plots -- Describing Correlations Task Cards
About this resource:This application practice has multiple uses in your classroom:Practice for an upcoming quiz or testComprehension CheckAdditional Practice during your "Activity" stationIntervention practice So much more!What topic(s) is/are covered?Scatter PlotsCorrelation types (positive, negative no/none)Describing Correlations (as x increases/decreases, y increases/decreases)Your answer key is included!How did you use this resource?I currently teach in the pull-out resource (POR) setting f
Subjects:
Grades:
6th - 10th
Types:
CCSS:
Also included in: Slope Applications Unit Activities Bundle!

STEM-ersion - Polynomial Functions Printable & Digital Activity
STEM-ersion assignments aim to immerse students in an authentic application within a STEM career. This STEM-ersion focuses on polynomial functions. Students often ask what careers will use certain math skills and I think this is an opportunity to show them where the thinking is used! These problems aim to help students construct responses with my Evidence - Analysis - Conclusion framework that I use in all of my classes. These questions are carefully crafted not to have one correct answer, but t
Subjects:
Grades:
6th - 12th
Types:
Also included in: STEMersion - ALGEBRA BUNDLE - Printable & Digital Activities
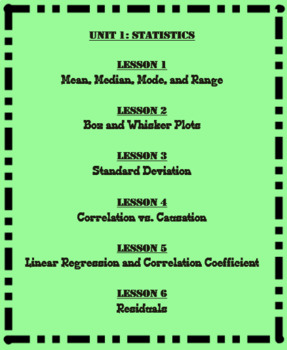
Unit 1-Statistics (Math 1)
This is the first Unit of the eight Units that I cover in Math 1. This unit is broken up in to six different lessons that are listed below. Each lesson includes a SMART Notebook presentation, a student note-taking guide, and an answer key. Also included in this unit are student flashcards, a test outline, and a 25 question multiple choice test.
Unit 1: Statistics
Lesson 1: Mean Median Mode Range Outliers and Skew
Lesson 2: Box and Whisker Plots
Lesson 3: Standard Deviation
Lesson 4: Correlati
Subjects:
Grades:
6th - 12th
CCSS:

STEM-ersion - Quadratic Functions Printable & Digital Activity
STEM-ersion assignments aim to immerse students in an authentic application within a STEM career. This STEM-ersion focuses on quadratic functions. Students often ask what careers will use certain math skills and I think this is an opportunity to show them where the thinking is used! These problems aim to help students construct responses with my Evidence - Analysis - Conclusion framework that I use in all of my classes. These questions are carefully crafted not to have one correct answer, but to
Subjects:
Grades:
6th - 12th
Types:
Also included in: STEMersion - ALGEBRA BUNDLE - Printable & Digital Activities
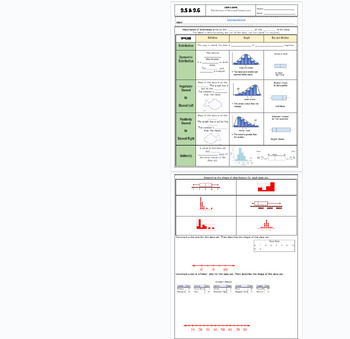
Data Distribution positive/negative skewed fillable notes UPDATED
Unit 9: Data and Stats: Updated(No 9.3/ Skip)9.5/9.6 Data Distribution (skewness)Students go over the vocabulary and complete the examples with the vocabulary scaffolded. Skewness is explained and how to identify it comparing data charts and box and whisker plots. Uses many visuals and examples to differentiate between that different graphs. Notes are scaffolded. Includes hook video hyperlinked on the "learning objective" title. Key is included and hyperlinked as a PDF in the heading highlighted
Subjects:
Grades:
6th - 12th, Higher Education, Adult Education
CCSS:
Also included in: Unit 9: Data and Statistics Fillable Notes
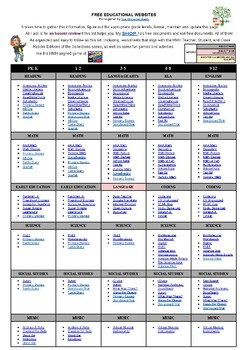
FREE EDUCATIONAL WEBSITES LIST 4 ALL GRADES K-12 AND SUBJECTS + TEACHER RESOURCE
Sometimes, you just need a list of websites for everyone. Here it is. FREE EDUCATIONAL WEBSITES Put together by Teach Me, Maria!It takes time to gather this information, figure out the appropriate grade levels, and format, maintain, and update this page. All I ask is for an honest review if this list helps you.
Subjects:
Grades:
PreK - 12th, Staff
Types:
Math March Madness - A Final Look (Freq Distributions, Stats, Regression Lines)
Fill out a bracket, watch the tournament unfold and then mathematically analyze how you did! This activity is flexible enough to be used for a variety of levels. I have used all 6 pages for an AP Statistics class, and have used pages 1 through 5 for an Algebra or Algebra 2 class. You could even use it in lower levels as long as you are covering percents, and basic stats like mean, median, mode and graphing. The document is editable so you can adjust/delete to tailor to the level of statistic
Subjects:
Grades:
4th - 12th, Higher Education
Types:

The Vitruvian Man Investigation: scatterplots & linear equations
This investigation involves testing Da Vinci's theory of the ideal human proportions depicted by his famous work, The Vitruvian Man. In this two to three day activity, students must prove his theory as true or false by collecting data, graphing their data and then analyzing their results.
The structure of this activity allows for straight forward differentiation and can be used as a creating and interpreting scatterplots activity, or a higher level activity on graphing lines and finding the li
Grades:
6th - 9th
Types:
CCSS:

Unit 9: Data and Statistics Fillable Notes
Unit 9: Data and Stats(No 9.3/ Skip)9.1 Central Tendencies: Mean, Median and Mode9.2 Graphical Data: Bar Charts, Dot Plots and Histograms9.3 NONE9.4A 5 number summary and box and whisker plots 9.4B Standard Deviation9.5/9.6 Data Distributions (skewness) left or right9.7 Frequency Tables and relative frequency tablesStudents go over the vocabulary and complete the examples with the vocabulary scaffolded. Notes are scaffolded. Includes hook video hyperlinked on the "learning objective" title. Key
Subjects:
Grades:
6th - 12th, Higher Education, Adult Education
Showing 1-24 of 64 results


