328 results
11th grade Common Core HSS-ID.B.6 resources
Goldie's FULL CURRICULUM for AP® Statistics
AP® Statistics Full CurriculumIn this product, you will receive all of Goldie's products related to AP® Statistics. All 9 units follow the College Board's© CED and include the following:Student Guided NotesStudent notes are "fill in the blank" style notes; teachers lead the lesson and work with students to complete the content. All content from the AP® CED is included and taught in the notes for this curriculum.Content VideosEach set of notes has a video to accompany it, where I teach the lesson
Subjects:
Grades:
10th - 12th
Types:
CCSS:
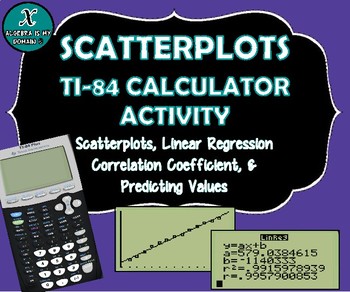
TI-84 CALCULATOR ACTIVITY - Data, Scatterplots, Regression & Line of Best Fit
This file includes four linear regression examples (all real-life data). The examples cover the following topics for the TI-84 graphing calculator:
* Creating a scatterplot
* Performing linear regression (finding the equation of the best-fit line)
* Interpreting the slope of the equation
* Calculating and interpreting the correlation coefficient
* Predicting values (using the linear regression equation)
The first example gives the step-by-step instructions to calculate all the necessary value
Subjects:
Grades:
7th - 12th, Higher Education
Types:
CCSS:
Statistics: FULL CURRICULUM BUNDLE
Statistics: Full Curriculum This is the FULL CURRICULUM bundle for my regular-level, Statistics course. If you are looking for my full curriculum for AP Statistics, follow the link here. This full curriculum is six units long and lasts 1 semester, approximately 90 school days. The following units are included in this bundle: Unit 1 – One-Variable DataUnit 2 – The Normal DistributionUnit 3 – Two-Variable DataUnit 4 – Collecting DataUnit 5 – ProbabilityUnit 6 – Random Variables Each unit contains
Subjects:
Grades:
11th - 12th
Types:
CCSS:
Linear, Exponential, & Quadratic Functions Regression Project | Scatter Plot PBL
Connect algebra to real life in this Graphing Linear, Exponential and Quadratic Functions Regression Project. This project based learning activity is perfect for students to write a linear, quadratic, or exponential equation, graph the scatter plot and function, and analyze the data. Students collect and analyze college tuition data to determine the linear, quadratic and/or exponential curve of best fit (regression), and predict future tuition costs. College Trend Project - Students will be able
Subjects:
Grades:
9th - 12th
Types:
CCSS:
Goldie’s AP® Statistics UNIT 2 PLANS – Exploring Two Variable Data
AP® Statistics Unit 2 – Exploring Two Variable DataUnit BundleThis unit contains everything you need to teach "Exploring Two Variable Data" in AP® Statistics or regular-level Statistics. Students will go through how to create, calculate, and compare numerical and graphical representations for two categorical variables; represent and describe bivariate quantitative data using scatterplots; calculate and interpret a linear regression model; use residuals and residual plots; and explore transformed
Subjects:
Grades:
10th - 12th
Types:
CCSS:
Also included in: Goldie's FULL CURRICULUM for AP® Statistics
Math March Madness Full Tournament Project {BUNDLE}
Harness the excitement of NCAA March Madness with this huge project for secondary math teachers that follows all stages of the tournament! This Common Core aligned bundle comes with bonus parts not sold individually in my store so you can create a rich immersion in the tournament, practice probability and statistics and learn some interesting new ones along the way! Save $3 plus get bonus content by bundling!You can pick and choose which parts you would like to incorporate, or follow my schedu
Subjects:
Grades:
6th - 12th, Higher Education
Types:
Goldie's AP® Statistics Semester 1 Multiple Choice Questions Bundle
AP® StatisticsSemester 1 (Units 1 - 4)Multiple Choice Questions (MCQ) Practice This is a resource that has 140 AP-level multiple-choice questions. You will receive the editable Word document for this resource, making it easy to modify and copy these questions in your classroom. You will also receive the PDF version for easy formatting. The answer key for this resource is included. These are BRAND NEW AP questions that I have developed for AP Statistics. These questions are not used anywhere else
Subjects:
Grades:
10th - 12th
Types:
CCSS:
Correlation All-Star -- Sports Data Analysis - 21st Century Math Project
Bring an authentic sports-based math project to your Algebra, Algebra 2 or PreCalculus classroom with Lines of Best Fit and Correlations! All in this 21st Century Math Project! Using data from the MLB, NBA, NFL and NHL students investigate correlations to some of sports most common questions like: "Do more shots result in more goals?" "Do hitters or pitchers have more impact on a team's wins?""What NFL stat is most strongly correlated with wins?" and the grand-daddy..."Can money buy championship
Subjects:
Grades:
7th - 12th
Types:
CCSS:
Urban Sprawl -- Polynomial Modeling - 21st Century Math Project
This 21st Century Math Project is an opportunity to bring polynomial functions into the real world. Along using polynomial functions and developing regressions skills, students will engage in thoughtful city planning from the perspective of a member of the City Commission for Urban Planning.In this 10 page document you will be given a mapping to the Content Standards, an outline for how to implement the unit and two main assignments. ***THIS PRODUCT HAS BEEN UPDATED WITH A GOOGLE SLIDES INTERACT
Subjects:
Grades:
8th - 12th
Types:
CCSS:
Algebra 1 Curriculum
Get a complete High School Algebra 1 curriculum including units on solving equations and inequalities, linear functions, exponents and exponential functions, factoring polynomials, quadratics, and more! These ready-to-use Algebra 1 resources include everything you need to teach high school algebra to your on-level or lower-level/special education class. Supplements would be needed for an honors class.Each unit contains guided notes, practice worksheets for the classroom and/or homework, activiti
Grades:
8th - 11th
CCSS:
![Preview of Statistics Final Exam and Review [AP, College, and Honors]](https://ecdn.teacherspayteachers.com/thumbitem/Statisticis-FinalReviewStudy-Guide-Exam-1711356723/original-699492-1.jpg)
Statistics Final Exam and Review [AP, College, and Honors]
You can use this Statistics Final Exam in an AP Statistics, Honors Statistics, or a College Statistics course as an assessment, review or both. What's Included?Included are 6 different versions, each including 60 well chosen representative questions in both multiple choice format and also in free response format*. These reviews and tests work well in class or as a take- home. The tests are editable with Adobe Acrobat Pro. Each test should take about 2 - 3 hours and can be taken with a graphin
Subjects:
Grades:
10th - 12th, Higher Education
Types:
CCSS:
Entrepreneur Projections - Financial Literacy & Systems - Math Project
Student put on their entrepreneur and investor hat to make expense and revenue projections for a business in this 21st Century Math Project. Students will work through a variety of entrepreneurial dilemmas and help small business owner make decisions relative to their break even point. In the final project, students will play the role of an Angel Investor, use regression to project revenue and expenses and analyze a financial forecast. Download the preview to see everything included! ***THIS PRO
Subjects:
Grades:
7th - 12th
Types:
CCSS:
Data Analysis and Statistics MEGA Bundle (Algebra 2 - Unit 13)
This is a MEGA Bundle of GUIDED NOTES WITH VIDEO LESSONS for your distance learning needs, homework, daily warm-up, content quizzes, mid-unit and end-unit assessments, review assignments, and cooperative activities for Algebra 2 Honors UNIT 13: DATA ANALYSIS & STATISTICS. #distancelearningtpt⭐Guided Student Notes⭐ 8-Page-Bound-Book-Style Foldables⭐ Google Slides®⭐ Fully-editable SMART Board® Slides⭐ Homework/Practice assignment⭐ Lesson Warm-Up (or exit ticket)⭐Daily Content Quiz (homework ch
Subjects:
Grades:
8th - 11th, Higher Education
CCSS:
High School Data Analysis Project
This project covers a large range of data analysis methods. There are eleven total parts to the project.
Part One: the students have to collect data from 20 students outside of the classroom. Directions specify to ask students from each grade level.
Part Two: Measures of Center and Variation. Students will calculate mean, median, mode, range, and standard deviation for some of the data collected. Definitions of each term are included.
Part Three: Box-And-Whisker Plot. Students will create t
Subjects:
Grades:
9th - 12th
Types:
CCSS:
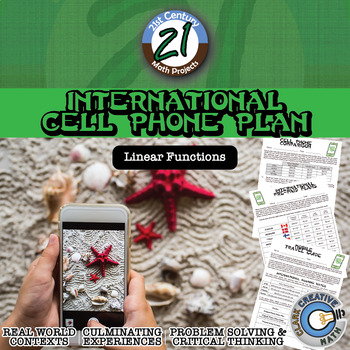
International Cell Phone Plan -- Linear Equations - 21st Century Math Project
As your students try to sneak cell phone usage into your lesson, make them consider the costs associated with international travel in this 21st Century Math Project!In this project, you will receive three separate assignments. In “Cell Phone Comparison” students will become familiar with writing linear equations from cell phone data and using the equations.In “International Pre Paid Plans” students will continue practicing writing and using linear equations. The data is from 11 different countri
Subjects:
Grades:
7th - 12th
Types:
CCSS:
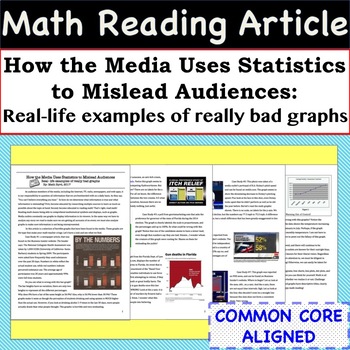
Statistics Math Article - Case Studies of Bad Graphs found in the Media
Incorporate Reading & Writing into the Math Classroom with this article and accompanying worksheet! The 4 page article is entitled - "How the Media Uses Statistics to Mislead Audiences: Real- life examples of really bad graphs". The worksheet helps students summarize the case studies and the article as a whole. This resource can be used in so many ways, some ideas are: station activity, independent reading assignment, small group activity, homework assignment, or whole class discussion.Skill
Subjects:
Grades:
8th - 11th
CCSS:
Also included in: Common Core Algebra 1 MATH READING ARTICLES - BUNDLE PRICE!
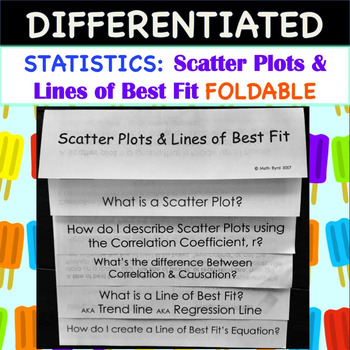
Statistics:Scatter Plots and Lines of Best Fit FOLDABLE
So Easy to Use! Simply print and fold! No need to rotate pages! Scatter Plots and Lines of Best Fit FOLDABLE also includes a PowerPoint to go along with the foldable.Foldable has 2 tiers of differentiation, perfect for the inclusive classroom! 1 set has fill-in-the-blank style notes within the foldable, while the other foldable has the notes already filled in. On both sets, students will have to work out the examples.Students will learn how to: Create Scatter PlotsDescribe Scatter Plots using Co
Subjects:
Grades:
8th - 11th
CCSS:
Also included in: Common Core Algebra 1: STATISTICS UNIT - BUNDLE PRICE!
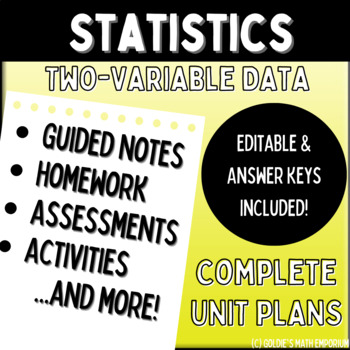
Statistics: Two Variable Data
StatisticsUnit 3: Two-Variable Data Complete Unit Bundle that teaches scatterplots, correlation, linear regression, and more! Welcome! These are the complete unit plans for the third unit in my regular level Statistics class. If you are interested in the AP Statistics unit plans, check out my listing here. Included in this resource: 5 complete sets of student guided notes (annotated answer keys included)5 homework problem sets + complete test review (annotated answer keys included)2 assessments
Subjects:
Grades:
10th - 12th
Types:
CCSS:
Also included in: Statistics: FULL CURRICULUM BUNDLE
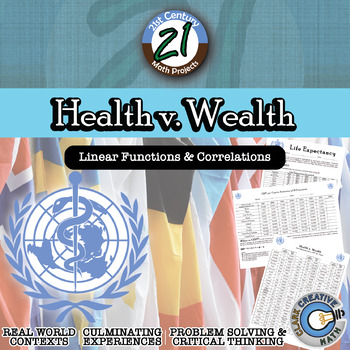
Health v. Wealth -- International Data & Correlation - 21st Century Math Project
Correlations and causation should be abundantly clear when students examine data of the Health and Wealth of over 80 nations around the world. The world is ever-changing and it is important for students to have a basic level of global awareness. In this 21st Century Math Project, students will use real world data to model regression functions, examine correlations and predict the future. In this project students will investigate global data sets to examine potential correlations related with the
Subjects:
Grades:
7th - 12th
Types:
CCSS:
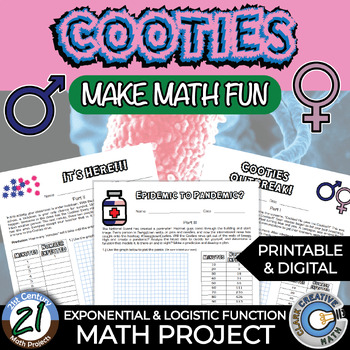
Cooties -- Pandemics -- Exponential & Logistic - 21st Century Math Project
It was an ordinary day. It was. Then came the screams, “Cooties! He gave me Cooties!!!” This was soon followed by “Cooties! She gave me Cooties!!!” Soon classes began to fall over (still breathing), but in an unconscious state. Bodies started turning blue and pink. A contagion was among them. The teachers, who have to receive Cooties immunizations to get their licensure, were left stunned.Turn your Algebra 2 or Pre-Calculus into a contagion command center with this 21st Century Math Project. Spe
Subjects:
Grades:
8th - 12th
Types:
CCSS:
High School Math Common Core Aligned IEP Goal Bank
This IEP goal bank was created to assist special education teachers with the task of writing standards-based IEP goals in math. After spending countless hours developing IEP goals myself and really having to think through how to best individualize goals and objectives for my own students, I wanted to share this resource to help other special education teachers gain back some of their time.This goal bank includes the following:An introduction and guide that explains how to use the document.Each s
Subjects:
Grades:
9th - 12th
CCSS:
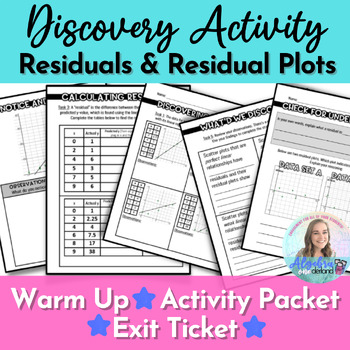
Residuals and Residual Plots Discovery Lesson Activity for Algebra 1
Make understanding residuals and residual plots east with this hands-on, discovery activity packet. Students will understand how residuals, regression and line of best fit connect and what the residuals tell us about the fit of the line. Included:A "Notice and Wonder" Task to start the lessonAn activity packet with three observation tasks related to line of best fit / linear regression, scatter plots, residuals and residual plots; culminating in a task that generalizes the concept of residuals a
Subjects:
Grades:
8th - 12th
Types:
CCSS:
Also included in: Algebra 1 Digital Activities for Google Slides Bundle #1!
Goldie’s Guided Note Bundle for AP® Statistics
AP® StatisticsGuided Note BundleNote: If you have purchased individual Unit Plans or Goldie's FULL CURRICULUM for AP® Statistics, you already have these resources. You do NOT need to purchase this.Welcome! This is a bundle for all of my guided notes for all Units of AP Statistics. All of the resources are 100% editable, to modify to fit your classroom needs. The zip folder includes the Word document, which you have permission to edit completely. The PDF version and answer keys are included for y
Subjects:
Grades:
10th - 12th
Types:
CCSS:
Gridiron Glory -- "Big Game" Data & Paper Football - 21st Century Math Project
I have heard that Americans like Football. I have also heard about an important game that happens in February. I have heard that it's a day that nachos dread. In this 21st Century Math Project, students will complete a variety Football-based assignments related to the Statistics strands of the Common Core. The project caps off with a Paper Football tournament that asks students to use expected value to guide their decisions!This product includes 3 prep assignments that reaches a variety of learn
Subjects:
Grades:
6th - 12th
Types:
CCSS:
Also included in: Probability & Expected Value Unit Bundle - Distance Learning Compatible
Showing 1-24 of 328 results

