59 results
Higher education Common Core HSS-ID.B.6 resources
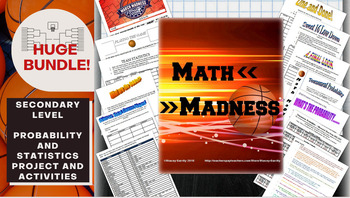
Math March Madness Full Tournament Project {BUNDLE}
Harness the excitement of NCAA March Madness with this huge project for secondary math teachers that follows all stages of the tournament! This Common Core aligned bundle comes with bonus parts not sold individually in my store so you can create a rich immersion in the tournament, practice probability and statistics and learn some interesting new ones along the way! Save $3 plus get bonus content by bundling!You can pick and choose which parts you would like to incorporate, or follow my schedu
Subjects:
Grades:
6th - 12th, Higher Education
Types:
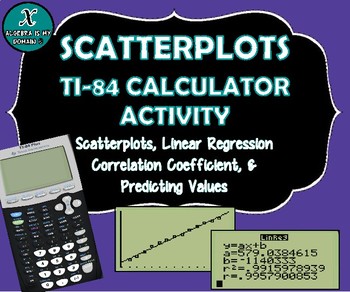
TI-84 CALCULATOR ACTIVITY - Data, Scatterplots, Regression & Line of Best Fit
This file includes four linear regression examples (all real-life data). The examples cover the following topics for the TI-84 graphing calculator:
* Creating a scatterplot
* Performing linear regression (finding the equation of the best-fit line)
* Interpreting the slope of the equation
* Calculating and interpreting the correlation coefficient
* Predicting values (using the linear regression equation)
The first example gives the step-by-step instructions to calculate all the necessary value
Subjects:
Grades:
7th - 12th, Higher Education
Types:
CCSS:
![Preview of Statistics Final Exam and Review [AP, College, and Honors]](https://ecdn.teacherspayteachers.com/thumbitem/Statisticis-FinalReviewStudy-Guide-Exam-1711356723/original-699492-1.jpg)
Statistics Final Exam and Review [AP, College, and Honors]
You can use this Statistics Final Exam in an AP Statistics, Honors Statistics, or a College Statistics course as an assessment, review or both. What's Included?Included are 6 different versions, each including 60 well chosen representative questions in both multiple choice format and also in free response format*. These reviews and tests work well in class or as a take- home. The tests are editable with Adobe Acrobat Pro. Each test should take about 2 - 3 hours and can be taken with a graphin
Subjects:
Grades:
10th - 12th, Higher Education
Types:
CCSS:
Data Analysis and Statistics MEGA Bundle (Algebra 2 - Unit 13)
This is a MEGA Bundle of GUIDED NOTES WITH VIDEO LESSONS for your distance learning needs, homework, daily warm-up, content quizzes, mid-unit and end-unit assessments, review assignments, and cooperative activities for Algebra 2 Honors UNIT 13: DATA ANALYSIS & STATISTICS. #distancelearningtpt⭐Guided Student Notes⭐ 8-Page-Bound-Book-Style Foldables⭐ Google Slides®⭐ Fully-editable SMART Board® Slides⭐ Homework/Practice assignment⭐ Lesson Warm-Up (or exit ticket)⭐Daily Content Quiz (homework ch
Subjects:
Grades:
8th - 11th, Higher Education
CCSS:
Data Analysis and Statistics Essentials (Algebra 2 - Unit 13)
Data Analysis & Statistics Essentials (Unit 13) is a complete set of GUIDED NOTES WITH VIDEO LESSONS for your distance learning needs, homework, warm-up exercises and daily content quizzes for your Algebra 2 Honors students. You will also find a set of GOOGLE SLIDES for your presentation needs.Guided Notes Format:The unit is organized into six lessons, aligned to CCSS, that will take approximately 15 instructional days. There is ample space for writing and recording knowledge in this format.
Subjects:
Grades:
8th - 11th, Higher Education
CCSS:
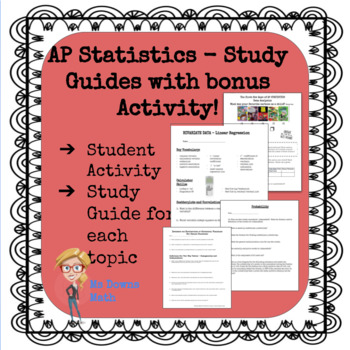
AP Statistics Study Guides - All Topics!
There is a pdf file study guide for each topic in the AP Statistics curriculum. Exploring Data, Normal Distributions, Linear Regressions, Experiments and Designing Studies, Probability, Random Variables, Sampling Distributions, Confidence Intervals, Hypothesis Tests, Comparing Populations, Chi Square Procedures, and Inference about Regression. I have students complete one for each unit. At the end of the year, they have a great study packet for the AP Exam! Student feedback has indicated that th
Subjects:
Grades:
9th - 12th, Higher Education, Adult Education
Types:
CCSS:
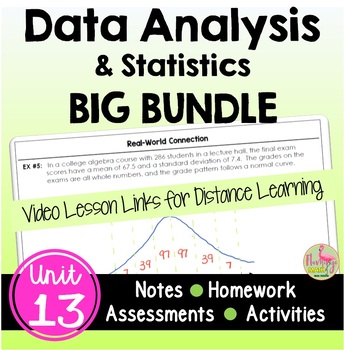
Data Analysis BIG Bundle (Algebra 2 - Unit 13)
This is a BIG Bundle of GUIDED NOTES WITH GOOGLE SLIDES and VIDEO LESSONS for your distance learning needs, homework, daily warm-up, content quizzes, mid-unit and end-unit assessments, review assignments, and cooperative activities for Algebra 2 Honors UNIT 13: DATA ANALYSIS & STATISTICS. #distancelearningtptWhat is included in each lesson?The unit is organized into SIX lessons, that will take approximately 15 instructional days.⭐ Guided Student Notes⭐ 8-Page Bound-Book Style Foldable⭐ GOOGL
Subjects:
Grades:
8th - 11th, Higher Education
CCSS:
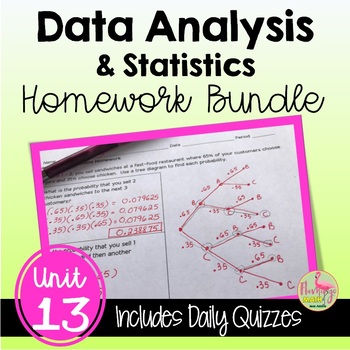
Data Analysis and Statistics Homework (Algebra 2 - Unit 13)
This is a bundle of homework and daily quizzes for Unit 13: DATA ANALYSIS & STATISTICS, designed for Algebra 2 Honors students. The file includes 17 pages of homework assignments plus two forms of a daily content quiz that you can use as a homework check, group work, or exit tickets.The unit includes the following topics:1) Measures of Central Tendency2) Analyzing Data3) Working With Samples4) Binomial Distributions5) Normal Distributions6) Confidence Intervals & Hypothesis TestingClick
Subjects:
Grades:
8th - 11th, Higher Education
Types:
CCSS:
Also included in: Algebra 2 Curriculum Big Bundle | Flamingo Math
TI-84 Plus Graphing Calculator Training
Learn the features of the Texas Instruments TI-83 Plus Graphing Calculator.This resource contains 16 handouts with examples, directions, screenshots, keystrokes and extra practice (with answer keys) for 16 topics:Solving EquationsCreating GraphsScatterplotsTable FeaturesList FeaturesRegression EquationsMatrix EquationsTransforming GraphsEvaluating FunctionsResidualsGraphing Piecewise FunctionsAnalyze FunctionsOne Variable StatisticsStoring FeaturesCreating PolygonsGraphing InequalitiesUse this r
Grades:
7th - 12th, Higher Education, Adult Education
CCSS:
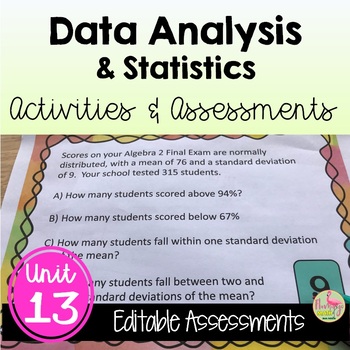
Data Analysis Activities and Assessments (Algebra 2 - Unit 13)
Data Analysis & Statistics Activity and Assessment Bundle:This resource is a bundled set of content quizzes, mid-unit quizzes, reviews, a station activity and two unit tests, both short response and multiple choice style. All keys are included in the unit bundle on Data Analysis & Statistics. The unit is designed to cover the material in-depth and to challenge your Algebra 2 Honors students.Additional Practice Assignments or Homework:6 Daily Quizzes (two forms each day)☑ Measures of Cent
Subjects:
Grades:
8th - 11th, Higher Education
Types:
CCSS:
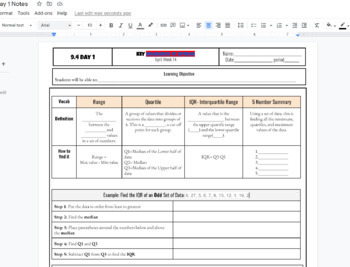
IQR interquartile Range and 5 number summary box and whisker plot Notes
IQR interquartile Range and 5 number summary box and whisker plot Notes including Q1, Q2, Q3, Min and Max and step by step both examples of finding the IQR and creating a box and whisker plot. Used in HS math 1 class WITH KEY INCLUDED AS a link to a printable PDF
Subjects:
Grades:
7th - 12th, Higher Education, Adult Education
CCSS:
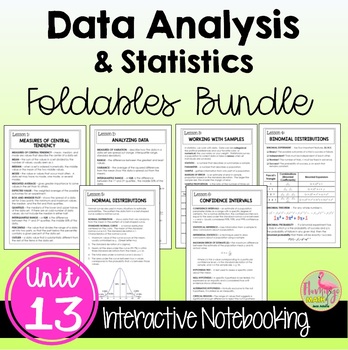
Data Analysis and Statistics FOLDABLES™ (Algebra 2 - Unit 13)
This bundle of 8-page Bound-Book-Style Foldables includes six lessons on topics in UNIT 13: Data Analysis & Statistics for your Algebra 2 Honors students. A set of finished notes and directions for creating the Foldables are also included.⭐ Bonus: A set of Google Slides for presenting the lesson and video lesson links are now included for distance learning and flipped classroom methods.☆FOLDABLESThree options of an 8-page Bound-Book Foldable® will help with differentiation.Option #1: All voc
Subjects:
Grades:
8th - 11th, Higher Education
CCSS:
Also included in: Algebra 2 Curriculum Big Bundle | Flamingo Math
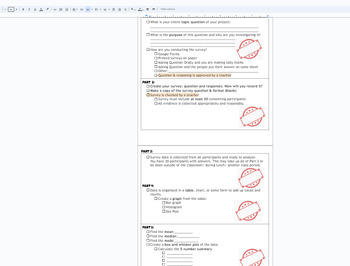
Statistics Survey project Discovery (broken down into sections) with Rubric
This is a broken down (scaffolded) packet of instructions/ guide for a Stats Project for Math 1 HS or 8th grade students. The goal of the project is for students to take a statistical survey on quantitative data (numbers) of their choice. Using this data from the survey, the following will be included in the project:Survey- the question being askedSurvey responses (requirement of 30)Data organization: Bar chart, Histogram, Dot PlotMeanMedianModeBox and Whisket Plot5 number summary (Q1,Q2,Q3, min
Subjects:
Grades:
7th - 12th, Higher Education, Adult Education
CCSS:
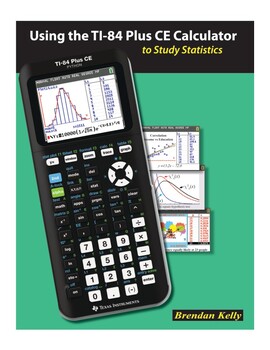
Using the TI-84 Plus CE Graphing Calculator to Study Statistics
Using the TI-84 Plus CE Calculator to Study StatisticsISBN 978-1-895997-59-0(102 pages; 8.5” x 11” trim size)The information age has made statistics one of the most important branches of mathematics. The ubiquity of real-world data enables us to explore statistical concepts using real data from interesting and current sources. As they work through the exercises in this book, students enter real data onto spreadsheets or into statistical plots on the TI-84 Plus CE Calculator while you guide their
Subjects:
Grades:
10th - 12th, Higher Education
Types:
CCSS:
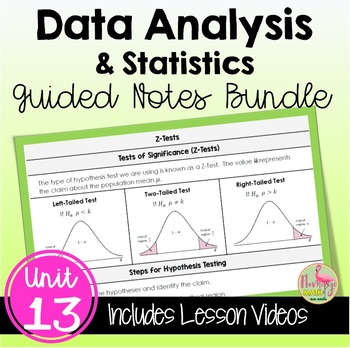
Data Analysis and Statistics Guided Notes (Algebra 2 - Unit 13)
Data Analysis & Statistics Guided Notes Bundle:Your Algebra 2 Honors students will have a set of Guided Student Notes plus Google Slides and a Warm-Up exercise with Video Lessons for each section to meet your flipped classroom or distance learning needs and a complete solution set for lessons covering the topics and concepts for Data Analysis & Statistics. Teachers also have a fully-editable pacing guide with topics and standards for your planning needs.Guided Notes Format:The unit is o
Subjects:
Grades:
8th - 11th, Higher Education
Types:
CCSS:
Also included in: Algebra 2 Curriculum Big Bundle | Flamingo Math
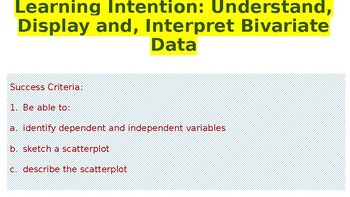
Bivariate Data
This PPT is an awesome tool for students who need understanding in Statistics and the application of it. It delve into the understanding, display and interpretation and reasoning of Bivariate displays whether given OR drawn by them.
Subjects:
Grades:
9th - 12th, Higher Education
CCSS:
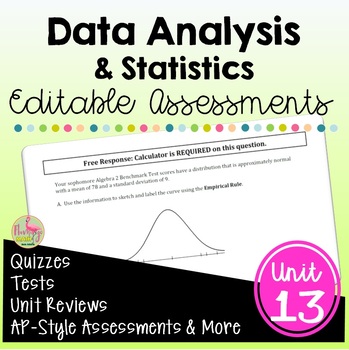
Data Analysis and Statistics Assessments (Algebra 2 - Unit 13)
Data Analysis & Statistics Assessments Bundle:This resource is a full unit of assessments for Algebra 2 Honors Unit 13: Data Analysis and Statistics. The product contains both a mid-unit reivew and an end-unit review assignment, two quizzes, and four unit tests. There is also one editable version for every review assignment, quiz and test to help you meet your personal assessment needs in your district or state.All keys are full solution sets and are included in the product.TABLE OF CONTENTS
Subjects:
Grades:
8th - 11th, Higher Education
Types:
CCSS:
Also included in: Algebra 2 Curriculum Mega Bundle | Flamingo Math
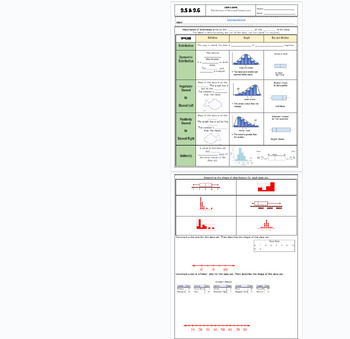
Data Distribution positive/negative skewed fillable notes UPDATED
Unit 9: Data and Stats: Updated(No 9.3/ Skip)9.5/9.6 Data Distribution (skewness)Students go over the vocabulary and complete the examples with the vocabulary scaffolded. Skewness is explained and how to identify it comparing data charts and box and whisker plots. Uses many visuals and examples to differentiate between that different graphs. Notes are scaffolded. Includes hook video hyperlinked on the "learning objective" title. Key is included and hyperlinked as a PDF in the heading highlighted
Subjects:
Grades:
6th - 12th, Higher Education, Adult Education
CCSS:
Also included in: Unit 9: Data and Statistics Fillable Notes
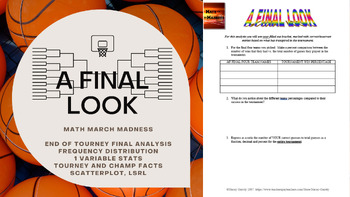
Math March Madness - A Final Look (Freq Distributions, Stats, Regression Lines)
Fill out a bracket, watch the tournament unfold and then mathematically analyze how you did! This activity is flexible enough to be used for a variety of levels. I have used all 6 pages for an AP Statistics class, and have used pages 1 through 5 for an Algebra or Algebra 2 class. You could even use it in lower levels as long as you are covering percents, and basic stats like mean, median, mode and graphing. The document is editable so you can adjust/delete to tailor to the level of statistic
Subjects:
Grades:
4th - 12th, Higher Education
Types:

Unit 9: Data and Statistics Fillable Notes
Unit 9: Data and Stats(No 9.3/ Skip)9.1 Central Tendencies: Mean, Median and Mode9.2 Graphical Data: Bar Charts, Dot Plots and Histograms9.3 NONE9.4A 5 number summary and box and whisker plots 9.4B Standard Deviation9.5/9.6 Data Distributions (skewness) left or right9.7 Frequency Tables and relative frequency tablesStudents go over the vocabulary and complete the examples with the vocabulary scaffolded. Notes are scaffolded. Includes hook video hyperlinked on the "learning objective" title. Key
Subjects:
Grades:
6th - 12th, Higher Education, Adult Education
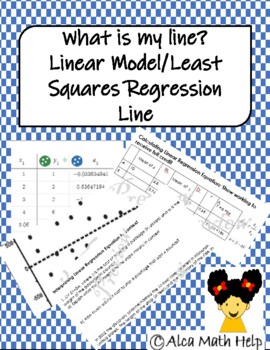
Least Squares Regression Line: What is my line?
At the end of this activity Students will be able to:Examine the residual values and determine the prediction the model made. Examine residual plots to determine the appropriateness in models.Calculate and interpret slope and y-intercept in contextEstimate the strength and relationship between variables using a scatterplot.Explain the difference between correlation and causationAnswer Key not included!This activity sheet can be used as a Unit Quiz, Classwork or HomeworkIt comprises of short answ
Subjects:
Grades:
9th - 12th, Higher Education, Adult Education, Staff
Types:
CCSS:
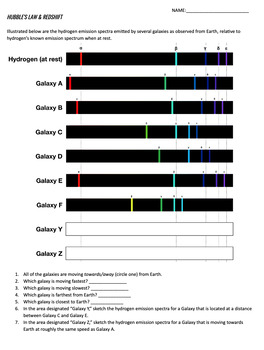
Hubble's Law & Expansion of the Universe Worksheets/Packet
This resource consists of three full-color worksheets that ask students to approach and work with Hubble's Law in three different ways.Worksheet #1 - HUBBLE'S LAW BASICS: Students use the famous "raisin bread" analogy to understand how Hubble's observations of receding galaxies led him to conclude that space itself was expanding. Students use a ruler to measure the before and after distances between "raisins" in an illustration of rising raisin bread. They find that no matter which pair of raisi
Subjects:
Grades:
8th - 12th, Higher Education
CCSS:
NGSS:
HS-ESS1-3
, HS-ESS1-2
, HS-PS4-1
Scatter Plot Project End of Year Math Activity with Real World Data
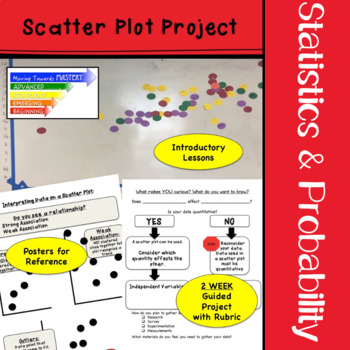
TWO Week guided project for constructing and interpreting scatter plots. This engaging scatter plot project is individualized to allow students to research areas of interest. This project is great for a math end of year activity but it can also be used year round! Students will gather data on their topic of choice and use the project plan to organize their data into a scatter plot. Students will then analyze the results of the data collected.Six posters to guide students as they work independent
Subjects:
Grades:
8th - 10th, Higher Education
Types:
CCSS:
Also included in: Middle School Math Projects for End of the Year Activities
Statistics Unit 1 Bundle - Introduction to Statistics Curriculum (8 days)
Statistics Unit 1 Bundle - Intro to Statistics Curriculum (8 days)This is an Introductory Unit for a Statistics class. The plans include common core math standards, time frame, activities, enduring understandings, essential questions, and resources used. It is designed to last 8 days, depending on pacing. The plans include: 22-slide presentation, with annotated guide for reference2 Worksheets"Do Now" Entrance problemsUnit ReviewUnit QuizUnit 1 Project - Gathering DataPacing guide with administra
Subjects:
Grades:
9th - 12th, Higher Education
CCSS:
Showing 1-24 of 59 results

