157 results
7th grade Common Core HSS-ID.B.6 resources
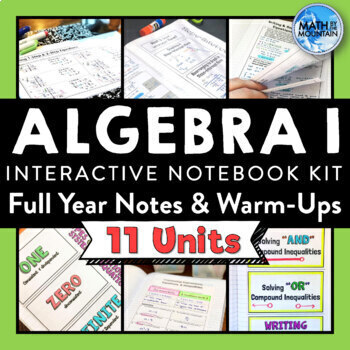
Algebra 1 Notes Interactive Notebook | Full Year Notes & Warm-Ups BUNDLE
This resource has it all with a full year of Algebra 1 notes, warm-ups, and pacing guides so you can confidently teach Algebra 1 without all of the hassle and time of making it yourself. Complete answer keys are always included. Additional bonus files are provided so you can get an easy start to using interactive notebooks, too! If you want to get all of my Algebra 1 interactive notebook kits in one place for the biggest discount, look no further, this bundle is for you! ⭐ Searching for print &a
Grades:
7th - 10th
CCSS:
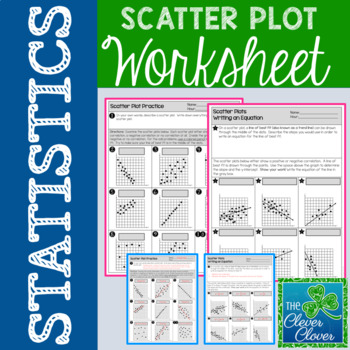
Scatter Plot Worksheet
Scatter Plot Worksheet
This resource allows students to explore scatterplots with a two page worksheet. Students are asked to define scatterplots in their own words. Nine questions ask students to identify the type of correlation (positive, negative or no correlation) that exists between two variables. Students are also asked to describe the steps used to write an equation for the line of best fit. Six additional questions require students to calculate the slope and determine the y-intercept
Subjects:
Grades:
6th - 9th, Adult Education
Types:
CCSS:
Also included in: Scatter Plot Mini-Bundle
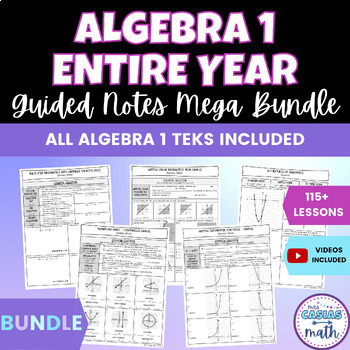
Algebra 1 Guided Notes Lessons Mega Bundle Entire Year
Are you looking for ready to go Algebra 1 lessons for the entire year? Get all of these Algebra 1 guided notes (116 lessons) for the lowest price in this bundle! These notes were built to align with the Algebra 1 TEKS, but many lessons align to CCSS and other standards as well. Each no-prep guided notes lesson comes out to less than $1/piece in this bundle! These notes get straight to the point of the skill being taught, which I have found is imperative for the attention span of teenagers! They
Subjects:
Grades:
7th - 9th
CCSS:
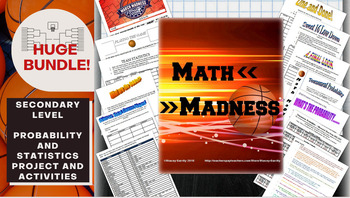
Math March Madness Full Tournament Project {BUNDLE}
Harness the excitement of NCAA March Madness with this huge project for secondary math teachers that follows all stages of the tournament! This Common Core aligned bundle comes with bonus parts not sold individually in my store so you can create a rich immersion in the tournament, practice probability and statistics and learn some interesting new ones along the way! Save $3 plus get bonus content by bundling!You can pick and choose which parts you would like to incorporate, or follow my schedu
Subjects:
Grades:
6th - 12th, Higher Education
Types:
NC Math 1 *PRACTICE LIKE A CHAMPION* Complete Bundle (552 EOC Aligned Items)
This bundle includes practice items for ALL 46 NC Math 1 state standards - 12 items per standard for a total of 552 practice EOC items in all.Perfect for end of semester review and practice for the NC Math 1 EOC or to usethroughout the course to assess student understanding on any standard at any time. Since the items are grouped by standard, they are perfectly organized for analyzing student data!Each standard's item set is also available individually in my TpT store, along with a full length P
Subjects:
Grades:
7th - 10th
Types:
CCSS:
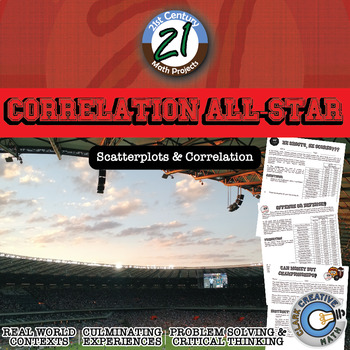
Correlation All-Star -- Sports Data Analysis - 21st Century Math Project
Bring an authentic sports-based math project to your Algebra, Algebra 2 or PreCalculus classroom with Lines of Best Fit and Correlations! All in this 21st Century Math Project! Using data from the MLB, NBA, NFL and NHL students investigate correlations to some of sports most common questions like: "Do more shots result in more goals?" "Do hitters or pitchers have more impact on a team's wins?""What NFL stat is most strongly correlated with wins?" and the grand-daddy..."Can money buy championship
Subjects:
Grades:
7th - 12th
Types:
CCSS:
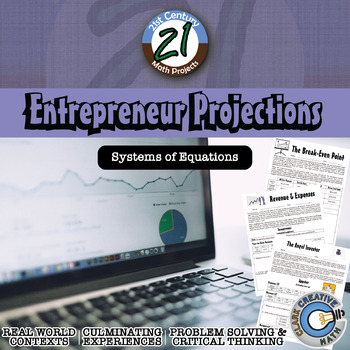
Entrepreneur Projections - Financial Literacy & Systems - Math Project
Student put on their entrepreneur and investor hat to make expense and revenue projections for a business in this 21st Century Math Project. Students will work through a variety of entrepreneurial dilemmas and help small business owner make decisions relative to their break even point. In the final project, students will play the role of an Angel Investor, use regression to project revenue and expenses and analyze a financial forecast. Download the preview to see everything included! ***THIS PRO
Subjects:
Grades:
7th - 12th
Types:
CCSS:
NC Math 1 Practice End-of-Course Test (North Carolina EOC Final Exam Review)
This full length 60-item multiple choice practice test is aligned to the North Carolina Standards for Math 1. It includes 16 non-calculator active questions and 44 calculator active questions. An answer key and item/standard alignment is included for easy data analysis.
Subjects:
Grades:
7th - 10th
Types:
CCSS:
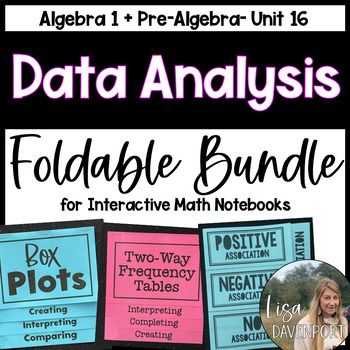
Data Analysis and Statistics Foldable Bundle
This foldable bundle includes skills associated with data and statistics taught within middle school math or algebra 1 standards:Mean, Median, Mode, RangeComparing CentersBox PlotsDot PlotsDisplaying Numerical DataAssociation within Scatter PlotsScatter PlotsWriting an Equation for a Trend LineStandard Deviation + The Empirical RuleData + Statistics in Algebra 1 Overview (Dot Plots, Histograms, Box Plots, + Two-Way Frequency TablesDetailed answer keys are included for each foldable.All of these
Grades:
7th - 10th
CCSS:
ALGEBRA 1 - ASSESSING EVERY STANDARD (bundle)
Have you tried to find quick assessments for ALGEBRA 1?So have I! After giving up the search, I made my own. This MEGA BUNDLE provides 48 mini-assessments for all the Algebra 1, Common Core standards;Number Quantity: NQ.1-3 (3 assessments)Creating Equations: CED.1-4 (4 assessments)Reasoning with Equations and Inequalities: REI. 1,3-7, 10-12 (9 assessments)The Real Number System: RN.1-3 (3 assessments)Interpreting Functions: FIF.1-9 (9 assessments)Building Functions: FBF.1-4 (4 assessments)Linea
Subjects:
Grades:
7th - 10th
Types:
CCSS:
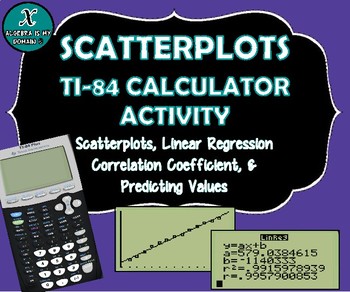
TI-84 CALCULATOR ACTIVITY - Data, Scatterplots, Regression & Line of Best Fit
This file includes four linear regression examples (all real-life data). The examples cover the following topics for the TI-84 graphing calculator:
* Creating a scatterplot
* Performing linear regression (finding the equation of the best-fit line)
* Interpreting the slope of the equation
* Calculating and interpreting the correlation coefficient
* Predicting values (using the linear regression equation)
The first example gives the step-by-step instructions to calculate all the necessary value
Subjects:
Grades:
7th - 12th, Higher Education
Types:
CCSS:
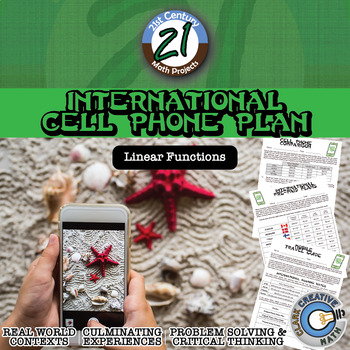
International Cell Phone Plan -- Linear Equations - 21st Century Math Project
As your students try to sneak cell phone usage into your lesson, make them consider the costs associated with international travel in this 21st Century Math Project!In this project, you will receive three separate assignments. In “Cell Phone Comparison” students will become familiar with writing linear equations from cell phone data and using the equations.In “International Pre Paid Plans” students will continue practicing writing and using linear equations. The data is from 11 different countri
Subjects:
Grades:
7th - 12th
Types:
CCSS:
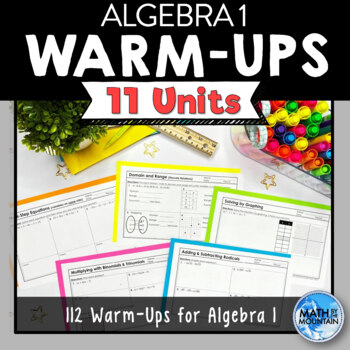
Algebra 1 Warm-Ups Full Year Bundle
Algebra 1 students need repetition to really master a concept. Recap warm-ups, also known as "bell-ringers" or "do now's," are the perfect way to start class every day and boost student achievement. Reasons to incorporate this into your classroom routine:They make it so much easier to catch and correct misconceptions that may have developed which helps to take student learning from half-baked to fully-doneThey give students another chance to ask questions about their learning from the prior dayS
Grades:
7th - 10th
CCSS:
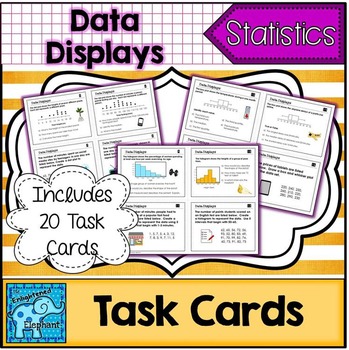
Data Display Task Cards
There are 20 total task cards, a student recording sheet and answer key. These tasks meet HSS.ID.A.1, HSS.ID.A.3, HSS.ID.B.6
There are 4 questions for each of the following types of data displays:
dot plots
stem and leaf plots
histograms
box plots
scatter plots
Students will be asked to read and interpret each type of data display as well as create each type of data display from a contextual set of data.
Use task cards at centers or stations, for entrance and exit tasks and for activities lik
Subjects:
Grades:
7th - 10th
Types:
CCSS:
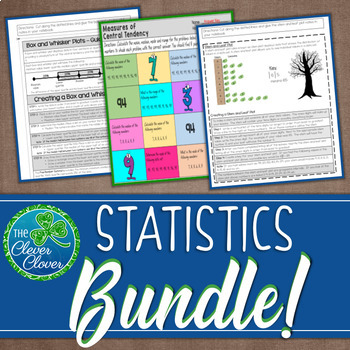
Statistics Bundle - Guided Notes, Worksheets & Scavenger Hunts!
Are your kids studying the measures of central tendency, box and whisker plots, stem and leaf plots, two-way tables, histograms and scatter plots? This valuable resource includes guided notes, worksheets, scavenger hunts, assessments and more that you can use for your statistics unit. Below you will find a brief description and link of each resource.
Measures of Central Tendency - Guided Notes, Worksheets and Scavenger Hunts
This resource includes guided notes, practice worksheets and two scave
Subjects:
Grades:
6th - 9th, Adult Education
CCSS:
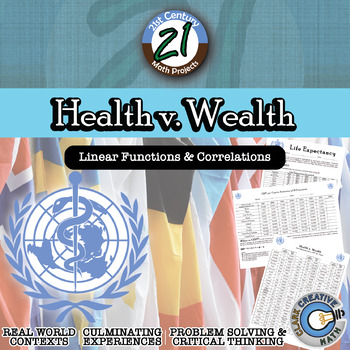
Health v. Wealth -- International Data & Correlation - 21st Century Math Project
Correlations and causation should be abundantly clear when students examine data of the Health and Wealth of over 80 nations around the world. The world is ever-changing and it is important for students to have a basic level of global awareness. In this 21st Century Math Project, students will use real world data to model regression functions, examine correlations and predict the future. In this project students will investigate global data sets to examine potential correlations related with the
Subjects:
Grades:
7th - 12th
Types:
CCSS:
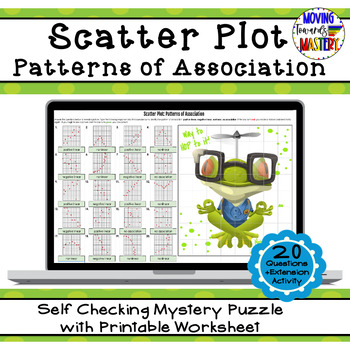
Scatter Plot: Patterns of Association Self Checking Mystery Picture
Engaging math self checking review activity to practice identifying patterns of association for scatter plots.This self-checking activity will allow students to practice identifying patterns of association for scatter plots. Students will use their understanding of scatter plots to answer questions to reveal pieces of a mystery puzzle as they work, just like a pixel art activity! If students answer incorrectly, the box will turn red and NO picture pieces will be revealed. This resource include
Subjects:
Grades:
7th - 10th
Types:
CCSS:
Also included in: 8th Grade Math Common Core Growing Bundle
Gridiron Glory -- "Big Game" Data & Paper Football - 21st Century Math Project
I have heard that Americans like Football. I have also heard about an important game that happens in February. I have heard that it's a day that nachos dread. In this 21st Century Math Project, students will complete a variety Football-based assignments related to the Statistics strands of the Common Core. The project caps off with a Paper Football tournament that asks students to use expected value to guide their decisions!This product includes 3 prep assignments that reaches a variety of learn
Subjects:
Grades:
6th - 12th
Types:
CCSS:
Also included in: Probability & Expected Value Unit Bundle - Distance Learning Compatible
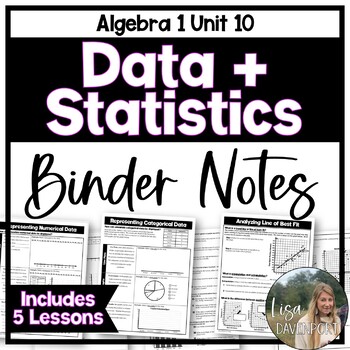
Data and Statistics - Editable Algebra 1 Binder Notes
This bundle includes editable binder notes and practice on 5 algebra 1 skills related to data and statistics. These notes provide the teacher and students with an organized set of guided notes and in class practice. Each topic includes 2 pages (1 page double-sided) of notes and examples. The following topics are included:Representing Univariate Numerical Data (using Line Plots, Histograms, and Box Plots)Representing Univariate Categorical Data (using Line Plots, Circle Graphs, and Bar Graphs)
Grades:
7th - 9th
CCSS:
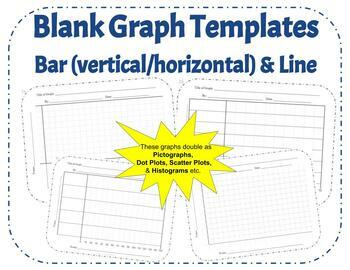
42 Blank Graph Templates: Horizontal & Vertical Bar Graph, Line Graph, Printable
Looking for an array of printable graph templates for all your future bar and line graph needs? Look no further! With 42 different templates ranging for bar graphs, to line graphs, varying in X values and Y values, this combination should be the last graph download you need to worry about for your class. These graphs can even be used as Histograms, Dot Plots, Scatter Plots, or a variety of other graphs to suit the needs of your classroom.I created this template to require all the basics of gr
Grades:
4th - 12th
Types:
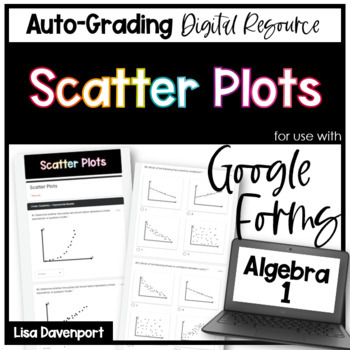
Scatter Plots Google Forms Homework
This 24-question, auto-grading Google Forms assignment provides students with practice analyzing & interpreting scatter plots. The following types of questions are included:Types of Correlation (positive/ negative/ no/ weak/ strong)Identifying Linear, Exponential, or QuadraticWriting a Line of Best FitInterpreting a Scatter Plot on Real- World DataQuestions are "drop-down", "multiple choice", and "select all that apply".This download also includes a PDF "worksheet" with the exact same quest
Subjects:
Grades:
7th - 10th
Types:
CCSS:
Also included in: Algebra 1 Google Forms Semester 2 Digital and Printable Homework Bundle
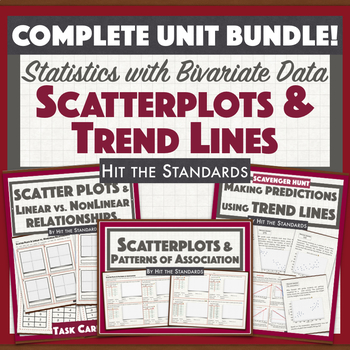
Statistics with Bivariate Data: Scatterplots & Trend Lines UNIT 6 BUNDLE 30% OFF
This unit bundles students expectations that address representing bivariates sets of data with scatterplots and representations of linear situations like constructing scatterplots and use them to describe the association of the data, constructing and using trend lines to make predictions and interpreting the slope of the line as the unit rate of the relationship, contrasting between linear proportional, linear not proportional and not linear relationships. The bundle includes worksheets, task ca
Subjects:
Grades:
6th - 9th
Types:
CCSS:

Statistics Survey Project - Project Based Learning (PBL) with Math
Watch your students dive into the world of math as they create, execute, and analyze their own survey! Students will demonstrate mastery of data gathering, survey sampling, developing appropriate survey questions, data tables, Direct Variation, discrete graphs, dot plots, box and whisker graphs, and calculating the inter-quartile range.The Unique Survey Project is highly engaging, capitalizing on the innate curiosity of the adolescent mind. You will love the low-prep instructional guide. Your st
Subjects:
Grades:
6th - 10th
Types:
Also included in: Fun with Ratios Activities Bundle - 7th Grade PBL with Math
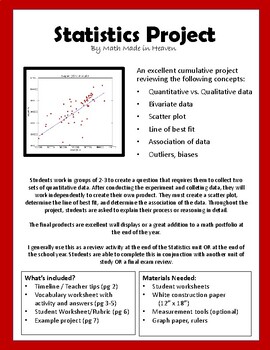
Statistics Project: scatter plot, line of best fit, association of data
An excellent cumulative project reviewing the following concepts: •Quantitative vs. Qualitative data•Bivariate data•Scatter plot•Line of best fit•Association of data (strong, weak, linear, non-linear, positive, and negative)•Outliers, biases, population, sample groupStudents work in small groups to create a question that requires them to collect two sets of quantitative data. After planning and conducting the experiment and collecting data, they will work independently to create their own produc
Subjects:
Grades:
7th - 10th
Types:
Showing 1-24 of 157 results

