22 results
Common Core HSS-ID.B.6 internet activities
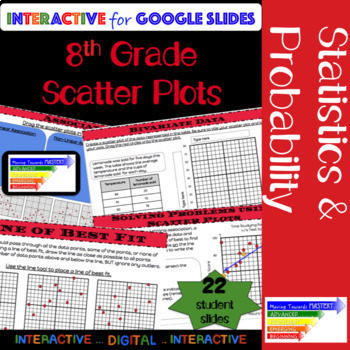
8th Grade Math Scatter Plot: Guided Interactive Lesson
Extensive ALL digital guided lesson for constructing and interpreting scatter plots.The slides are scaffolded to build understanding. Students will progress from identification of terms to making predictions involving bivariate data. The guided slides will begin with identification, move towards assisted analysis, and conclude with independent practice.Slides include...♦ Definitions and Visual Representations♦ Identification and Use of Terms→ Bivariate Data→ Scatter Plot→ Linear, Nonlinear, &
Subjects:
Grades:
8th - 10th
Types:
CCSS:
Also included in: 8th Grade Math Common Core Growing Bundle
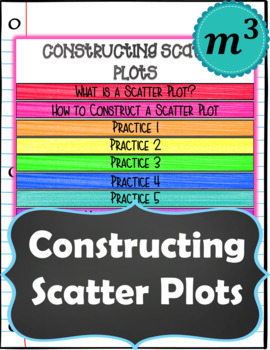
Constructing Scatter Plots Digital Notes & 2 Quizzes (GOOGLE) (Distance Learning
Product DescriptionGoogle Slides Digital Interactive Notes. The notes are everything beneficial of an interactive notebook without all the paper, glue, scissors, etc.Content:Students will be able to construct scatter plots given a set of data. Students will be able to identify positive correlation, negative correlation, and no correlation. Includes:Google Slides: Constructing Scatter Plots Digital NotesGoogle Forms: Self Grading Quick Check Quiz 1 & Self Grading Quick Check Quiz 2Answer KeyT
Subjects:
Grades:
6th - 9th
Types:
CCSS:
Also included in: 8th Grade Math Digital Notes GROWING BUNDLE (Distance Learning)
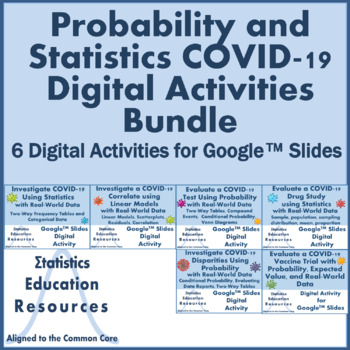
Bundle: Probability and Statistics COVID-19 Digital Activities (Common Core)
Bundle: Probability and Statistics COVID-19 Digital Activities (Common Core) This product is a bundle that includes 6 digital activities that were created in Google™ Slides. Each activity includes a background context relevant to COVID-19, summaries of real-world COVID-19 data derived from international or national health organizations or published research reports, detailed answer key, and instructions for accessing the activities. These activities are very challenging, focused on statistical
Subjects:
Grades:
9th - 12th
Types:
CCSS:
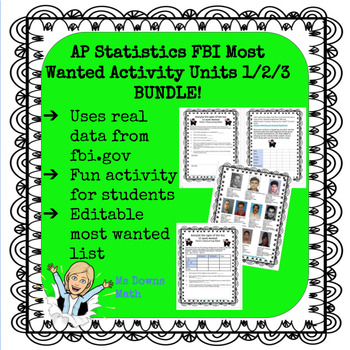
FBI Most Wanted AP Stat - Analyze Data, Normal Distributions, Linear Regression
I have created a series of activities for several units in the AP Statistics curriculum. The students love using data from fbi.gov to review concepts. This activity involves analyzing data related to the top 10 most wanted fugitives. I created this activity in May of 2020 and used the top 10 at that time. In the folder, you will find an editable slide of the top 10 if you want to change it.The answer key for the unit is based on the original top 10 that I used. Teachers have the option of having
Subjects:
Grades:
10th - 12th
Types:
CCSS:

Introduction to Functions | Unit with Videos
Each lesson in this Introduction to Functions Unit is taught via video with accompanying notes, practice, review, and assessments. This unit teaches the following concepts:* Graphing Relationships * Relations & Functions* Functional Notation * Graphing Linear Equations * Intercepts * Direct Variation * Scatter PlotsThis unit includes: * Video lessons that teach each concept in a way students can easily understand * Guided student notes that keep students engaged, hold them accountable, and s
Grades:
8th - 9th
Types:
CCSS:
Also included in: Algebra 1 Curriculum with Videos + ACTIVITIES Bundle
FREE EDUCATIONAL WEBSITES LIST 4 ALL GRADES K-12 AND SUBJECTS + TEACHER RESOURCE
Sometimes, you just need a list of websites for everyone. Here it is. FREE EDUCATIONAL WEBSITES Put together by Teach Me, Maria!It takes time to gather this information, figure out the appropriate grade levels, and format, maintain, and update this page. All I ask is for an honest review if this list helps you.
Subjects:
Grades:
PreK - 12th, Staff
Types:
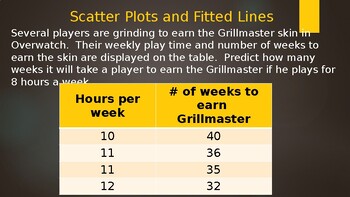
Scatter Plots and Fitted Lines -PowerPoint (w/ free video) -Distance Learning
PowerPoint with examples for direct instruction. This lesson has examples for students to practice making a scatter plot, drawing a line of best fit (trend line), and writing an equation to model the situation either in slope-intercept form (y=mx+b) or point-slope form (y=m(x-x1)+y1).The video for this lesson for review or absent students is on https://youtu.be/syShp8oA9NY
Grades:
9th
CCSS:
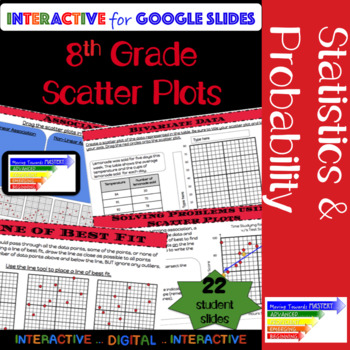
Scatter Plot Interactive for Google Classroom
Extensive ALL digital guided lesson for constructing and interpreting scatter plots.The slides are scaffolded to build understanding. Students will progress from identification of terms to making predictions involving bivariate data. The guided slides will begin with identification, move towards assisted analysis, and conclude with independent practice.Slides include...♦ Definitions and Visual Representations♦ Identification and Use of Terms→ Bivariate Data→ Scatter Plot→ Linear, Nonlinear, &
Subjects:
Grades:
8th - 10th
Types:
CCSS:
Also included in: Middle School Math Digital Guided Interactive Lessons
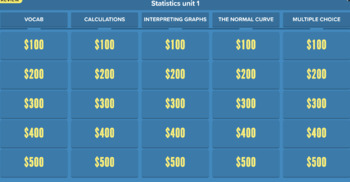
AP stats Unit 1 review jeopardy-style game
Included in purchase is the answer key in order (Category 1 $100-500, category 2 $100-500, etc.) and the link to the jeopardy game website. Membership is not needed to play on the website, but you will need to upgrade to pro on their site if you want the buzzer mode (not necessary but fun if your students are very competitive) follows Unit one vocab and example problems of AP Statistics (Categorical and quantitative data, normal curve)
Subjects:
Grades:
11th - 12th
Types:
CCSS:
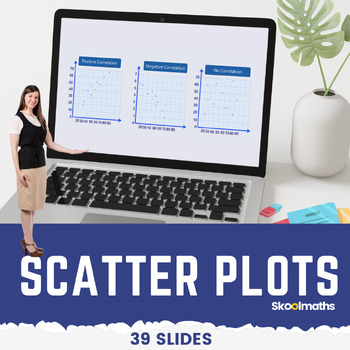
Eight Grade Scatter Plots Digital Math Lesson and Activities CCSS 8.SP.A.1
Eight Grade Scatter Plots Digital Math Lesson and ActivitiesTeach your high school grade how to use and interpret scatter graphs; recognize correlation; draw and use lines of best fit to make predictions?In this lesson, learners will be able to:use and interpret scatter graphs of bivariate data;recognize different types of correlation;draw estimated lines of best fit; anduse lines of best fit to make predictions.
Subjects:
Grades:
8th - 10th, Staff
Types:
CCSS:
Investigate a COVID-19 Correlate using Linear Models of Real Data
Distance Learning: Investigate a COVID-19 Correlate using Linear Models with Real-World Data (Common Core) This Google™ Slides digital activity involves interpreting real US state health department surveillance data on COVID-19 as a member of a team of statisticians. Students will estimate a line of best fit using a scatterplot with county-level COVID-19 case rates and county-level age distributions. Next, students will interpret the model, evaluate the model fit using residuals, and identify re
Subjects:
Grades:
8th - 12th
Types:
CCSS:
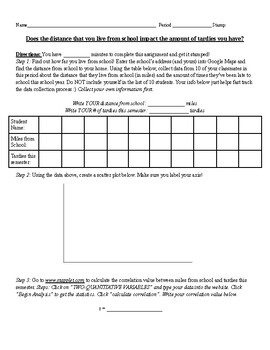
Correlation and Least Squares Regression Line Activity: High School Statistics
Hi! This activity will take 40 minutes to 1 hour to complete. It requires students to collect data from their classmates and use the data to do a regression analysis. The activity provides a statistical analysis website plus instructions for students to do regression analysis calculations. The materials students will need include a computer. Optional materials include a calculator. This activity can be provided on Google Classroom or printed as a physical copy for students to write on (preferred
Subjects:
Grades:
9th - 12th
Types:
CCSS:
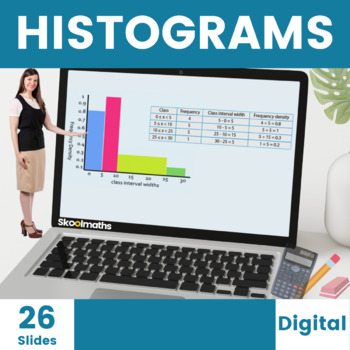
Histograms Digital Lesson for High School
Teach your High School students how to Interpret and Construct Histograms with unequal class intervals with these completely interactive digital home learning resources with engaging content and instant learner feedback. Buy this great value 26-page bundle of interactive histogram activities today to save you hours of planning and don't forget to leave an honest review if you download this worksheet for TPT credit :)Like this? You might also like...Conditional ProbabilityCalculating AveragesCond
Subjects:
Grades:
8th - 10th, Higher Education
CCSS:
Also included in: Complete Statistics and Probability Bundle | Digital and Print

Scatter Plots and Correlation Coefficient with Desmos and/or Google Sheets
These are the slides I use to introduce correlation coefficient (informally) and using technology to generate a best fit line for data to my 9th grade Algebra 1 students.You can delete / customize / replace / or use as are the first few slides to your liking and/or district's preferred presentation style for teaching a lesson. The main item you are purchasing are slides 5-7 which show students step-by-step (with pictures) how to enter data and generate a best fit linear equation and correlation
Subjects:
Grades:
7th - 12th, Higher Education
Types:
25:27
Scatter Plots Video Lesson with Guided Notes
This video lesson is perfect for sub plans, class activities, math centers, remedial help, or flipping your class. This video lesson teaches students about scatter plots. In particular, your students will be able to...Explain the terms scatter plot, trend line, linear regression, correlation, interpolation, and extrapolation Draw a trend lineExplain how the correlation coefficient portrays how strong the correlation isIdentify positive and negative correlation, strong and weak correlation given
Subjects:
Grades:
8th - 9th
Types:
CCSS:
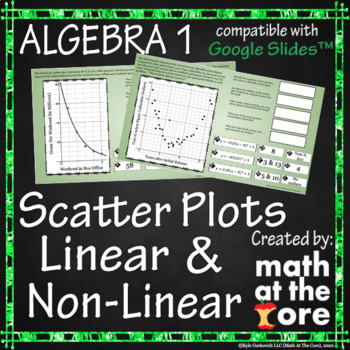
Scatter Plots - Linear & Non-Linear for Google Slides™
- Great for online and distance learning! Created to be compatible with Google Slides™!- In this digital activity, students will analyze scatter plots and determine the function of best fit. They will use the graph and the equation of that function to predict values. They should be familiar with writing the equation of linear and non-linear functions.- The activity has 33 different problems. Students will need to know how to identify which function represents the best fit for the trend given gra
Subjects:
Grades:
8th - 9th
Types:
CCSS:
Also included in: Algebra 1 Extended - Unit 9 - BUNDLE for Google Slides™
Algebra/Statistics: What does the data tell you? (Scatterplots)
Students work with a partner to compile data from the internet, which they then create a scatterplot and answer questions on their data based on linear regression lines, correlation coefficients, coefficient of determination, etc. Students are to write their findings into a research paper.
Subjects:
Grades:
9th - 12th, Higher Education
CCSS:
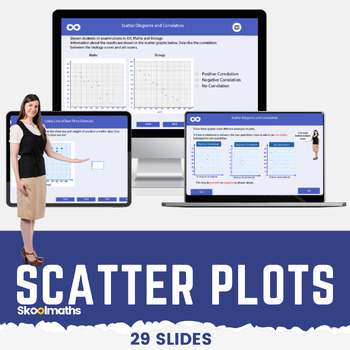
Scatter Plots | Correlation | Line of Best Fit Digital Math Lesson CCSS 8.SP.A.1
Scatter Plots | Correlation | Line of Best Fit Digital Math Lesson CCSS8.SP.A.1Want a high-engagement interactive math lesson that will teach your high school grade how to use and interpret scatter graphs; recognize correlation; draw and use lines of best fit to make predictions?In this lesson, learners will be able to:use and interpret scatter graphs of bivariate data;recognize different types of correlation;draw estimated lines of best fit; anduse lines of best fit to make predictions.The less
Subjects:
Grades:
8th - 10th
CCSS:
Also included in: Complete Statistics and Probability Bundle | Digital and Print
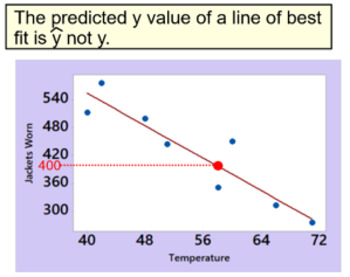
Scatter Plots and Linear Regression For PDF, 7 Assignments + 3 Intros
Included in this zip folder are 13 PDF files. 7 are assignments, 1 is a reference, 3 are intro's and 2 are uploads for Google Classroom or similar site. A brief description of each:The reference is a 1 page printable that defines:1. x bar2. y bar3. y hat4. least squares regression line5. correlation coefficient6. Independent and Dependent Variable7. Positive and negative correlationInto #1 is a 20 page file. The emphasis is scatter plots and limiting the number of tick marks to 5 on each axis
Subjects:
Grades:
8th - 12th
Types:
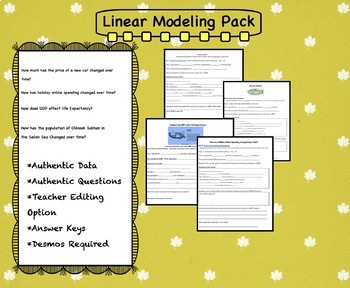
Linear Modeling Pack
4 Different Authentic Scenarios to help students practice linear modeling with Desmos. These 4 scenarios are all structured the same way to help students really understand the model and use the model to make predictions. All of the scenarios are editable by the teacher and come with an answer key. These modeling exercises require the use of Desmos. Each scenario comes with a Desmos graph that uses authentic data.Essential Question: How much is that new car going to cost me? Essential Question: H
Subjects:
Grades:
8th - 11th
Types:
CCSS:
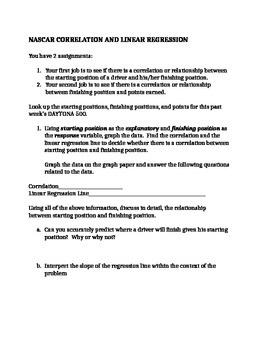
NASCAR Linear regression activity
Students will be looking at the correlation and the linear relationship between starting position and finishing position is a NASCAR race. They will also look at the correlation and relationship between finishing place and NASCAR points. Students will also interpret the slope of the the regression line in this activity.
This activity can be changed to use the most recent race results. You can let them look up the data on the internet or provide it for them.
Most of the time there will not be a
Subjects:
Grades:
11th - 12th
Types:
CCSS:

2-Day Flipped Classroom Lesson: Linear Regression
This 2-day lesson contains several java manipulatives and instructional videos from Khan Academy to help students in 9th grade
Algebra to understand the concepts behind linear regression, r values and r-squared values. You must develop your own in class activities but this document contains the "homework."
Subjects:
Grades:
8th - 9th
Types:
CCSS:
Showing 1-22 of 22 results

