4 results
Common Core HSS-ID.B.6 lectures

Lesson 3: Two Variable Data: Statistics (correlation, regressions, scatter plot)
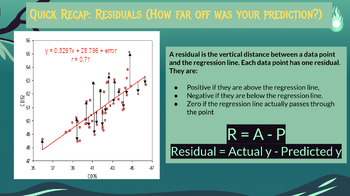
Hello!This is a lesson (powerpoint) on two-variable data. It includes vocabulary and guided practice on how to create scatter plots, calculate and interpret correlation, and write regression lines. This lesson should span through two weeks. You can find supplementary activities to this lesson on my storefront! If you teach StatsMedic, it's aligned to the cadence of StatsMedic lessons and activities. This resource is best downloaded to Google Drive and then edited as needed for your students. Ple
Subjects:
Grades:
10th - 12th
Types:
CCSS:

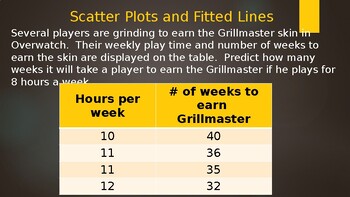
Scatter Plots and Fitted Lines -PowerPoint (w/ free video) -Distance Learning
PowerPoint with examples for direct instruction. This lesson has examples for students to practice making a scatter plot, drawing a line of best fit (trend line), and writing an equation to model the situation either in slope-intercept form (y=mx+b) or point-slope form (y=m(x-x1)+y1).The video for this lesson for review or absent students is on https://youtu.be/syShp8oA9NY
Grades:
9th
CCSS:

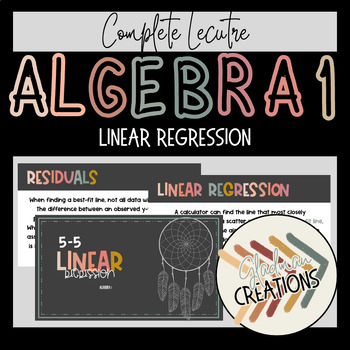
Algebra 1 Lesson - Linear Regression
This complete lesson can be used with any curriculum and each student will be able toWrite equations of best-fit lines using linear regressions.Determine how well functions fit sets of data.This lesson is done with a bohemian style color pallet; all material is editable, if you need to adjust to your teaching style or your classroom curriculum.
Subjects:
Grades:
9th - 12th
CCSS:
Also included in: Algebra 1 Lesson BUNDLE - Creating Linear Equations

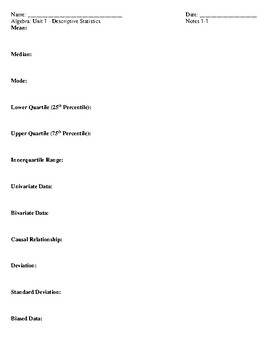
Algebra: Statistics Notes Packet
Complete notes packets with blank templates and answer keys that cover the following topics:
- Basic Stats definitions
- Box and Whisker Plots
- Stem and Leaf
- Frequency Histograms
- Cumumaltive Frequency Histograms
- Slope
Subjects:
Grades:
8th - 10th
CCSS:
Showing 1-4 of 4 results

