75 results
Common Core HSS-ID.B.6 projects
Linear, Exponential, & Quadratic Functions Regression Project | Scatter Plot PBL
Connect algebra to real life in this Graphing Linear, Exponential and Quadratic Functions Regression Project. This project based learning activity is perfect for students to write a linear, quadratic, or exponential equation, graph the scatter plot and function, and analyze the data. Students collect and analyze college tuition data to determine the linear, quadratic and/or exponential curve of best fit (regression), and predict future tuition costs. College Trend Project - Students will be able
Subjects:
Grades:
9th - 12th
Types:
CCSS:
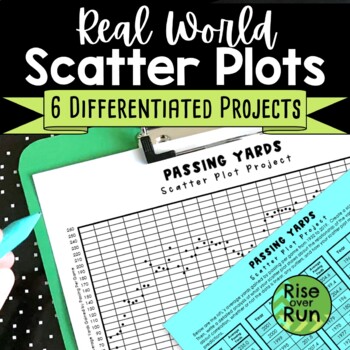
Scatter Plot Project with Real World Sports Data
Practice creating and analyzing scatter plots with these six differentiated real world projects. Students are provided statistics for a sport and must graph the data. Then, they write an analysis describing correlation, whether or not the data is linear, any outliers, and how the scatter plot might be used to make predictions. The scatterplots range from 38 points to 149 points, so they can be used to differentiate. The scatter plots will take a little time to plot, but they result in real
Subjects:
Grades:
8th - 9th
Types:
CCSS:
Also included in: 8th Grade Math Activities & Lessons Bundle for the Whole Year
Math March Madness Full Tournament Project {BUNDLE}
Harness the excitement of NCAA March Madness with this huge project for secondary math teachers that follows all stages of the tournament! This Common Core aligned bundle comes with bonus parts not sold individually in my store so you can create a rich immersion in the tournament, practice probability and statistics and learn some interesting new ones along the way! Save $3 plus get bonus content by bundling!You can pick and choose which parts you would like to incorporate, or follow my schedu
Subjects:
Grades:
6th - 12th, Higher Education
Types:
Correlation All-Star -- Sports Data Analysis - 21st Century Math Project
Bring an authentic sports-based math project to your Algebra, Algebra 2 or PreCalculus classroom with Lines of Best Fit and Correlations! All in this 21st Century Math Project! Using data from the MLB, NBA, NFL and NHL students investigate correlations to some of sports most common questions like: "Do more shots result in more goals?" "Do hitters or pitchers have more impact on a team's wins?""What NFL stat is most strongly correlated with wins?" and the grand-daddy..."Can money buy championship
Subjects:
Grades:
7th - 12th
Types:
CCSS:
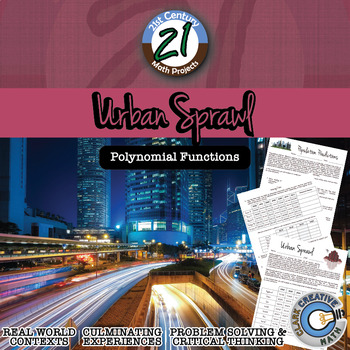
Urban Sprawl -- Polynomial Modeling - 21st Century Math Project
This 21st Century Math Project is an opportunity to bring polynomial functions into the real world. Along using polynomial functions and developing regressions skills, students will engage in thoughtful city planning from the perspective of a member of the City Commission for Urban Planning.In this 10 page document you will be given a mapping to the Content Standards, an outline for how to implement the unit and two main assignments. ***THIS PRODUCT HAS BEEN UPDATED WITH A GOOGLE SLIDES INTERACT
Subjects:
Grades:
8th - 12th
Types:
CCSS:
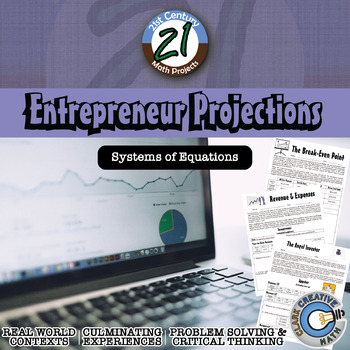
Entrepreneur Projections - Financial Literacy & Systems - Math Project
Student put on their entrepreneur and investor hat to make expense and revenue projections for a business in this 21st Century Math Project. Students will work through a variety of entrepreneurial dilemmas and help small business owner make decisions relative to their break even point. In the final project, students will play the role of an Angel Investor, use regression to project revenue and expenses and analyze a financial forecast. Download the preview to see everything included! ***THIS PRO
Subjects:
Grades:
7th - 12th
Types:
CCSS:
High School Data Analysis Project
This project covers a large range of data analysis methods. There are eleven total parts to the project.
Part One: the students have to collect data from 20 students outside of the classroom. Directions specify to ask students from each grade level.
Part Two: Measures of Center and Variation. Students will calculate mean, median, mode, range, and standard deviation for some of the data collected. Definitions of each term are included.
Part Three: Box-And-Whisker Plot. Students will create t
Subjects:
Grades:
9th - 12th
Types:
CCSS:
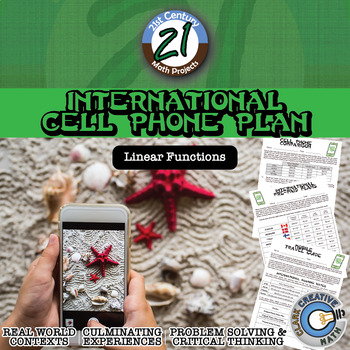
International Cell Phone Plan -- Linear Equations - 21st Century Math Project
As your students try to sneak cell phone usage into your lesson, make them consider the costs associated with international travel in this 21st Century Math Project!In this project, you will receive three separate assignments. In “Cell Phone Comparison” students will become familiar with writing linear equations from cell phone data and using the equations.In “International Pre Paid Plans” students will continue practicing writing and using linear equations. The data is from 11 different countri
Subjects:
Grades:
7th - 12th
Types:
CCSS:
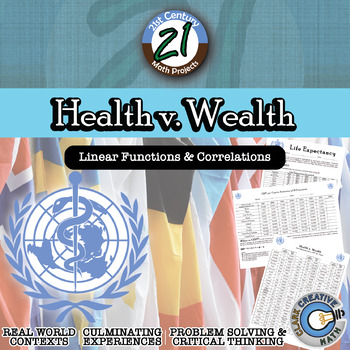
Health v. Wealth -- International Data & Correlation - 21st Century Math Project
Correlations and causation should be abundantly clear when students examine data of the Health and Wealth of over 80 nations around the world. The world is ever-changing and it is important for students to have a basic level of global awareness. In this 21st Century Math Project, students will use real world data to model regression functions, examine correlations and predict the future. In this project students will investigate global data sets to examine potential correlations related with the
Subjects:
Grades:
7th - 12th
Types:
CCSS:
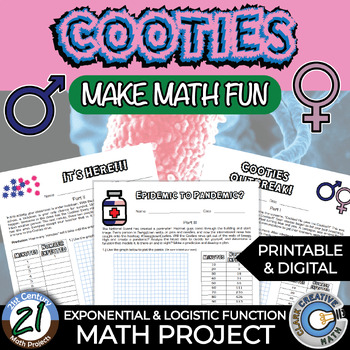
Cooties -- Pandemics -- Exponential & Logistic - 21st Century Math Project
It was an ordinary day. It was. Then came the screams, “Cooties! He gave me Cooties!!!” This was soon followed by “Cooties! She gave me Cooties!!!” Soon classes began to fall over (still breathing), but in an unconscious state. Bodies started turning blue and pink. A contagion was among them. The teachers, who have to receive Cooties immunizations to get their licensure, were left stunned.Turn your Algebra 2 or Pre-Calculus into a contagion command center with this 21st Century Math Project. Spe
Subjects:
Grades:
8th - 12th
Types:
CCSS:
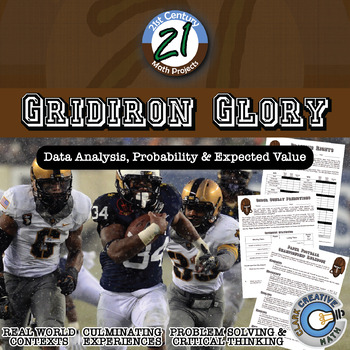
Gridiron Glory -- "Big Game" Data & Paper Football - 21st Century Math Project
I have heard that Americans like Football. I have also heard about an important game that happens in February. I have heard that it's a day that nachos dread. In this 21st Century Math Project, students will complete a variety Football-based assignments related to the Statistics strands of the Common Core. The project caps off with a Paper Football tournament that asks students to use expected value to guide their decisions!This product includes 3 prep assignments that reaches a variety of learn
Subjects:
Grades:
6th - 12th
Types:
CCSS:
Also included in: Probability & Expected Value Unit Bundle - Distance Learning Compatible
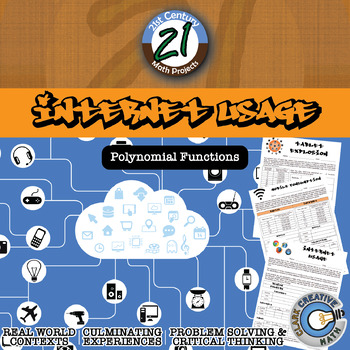
Internet Usage -- Intl Polynomial Regression - 21st Century Math Project
Experts believe that in the next twenty years the internet will be as integrated into our life as electricity. Today, the internet holds more information than you could read in 1,000 lifetimes. Today, there are 644 million active websites and that number is growing each day. In the United States, we may take for granted how easy it is to get on the internet. In different parts of the world this isn’t the case. Bring Internet Usage Statistics into your Algebra 2 / PreCalculus classroom with polyn
Subjects:
Grades:
8th - 12th
Types:
CCSS:
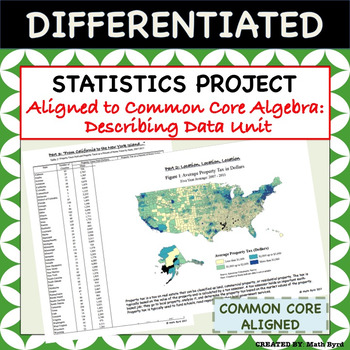
Statistics Project - Aligned to Common Core Algebra - Describing Data Unit
This differentiated U.S. Home Energy & Tax Themed Statistics Project covers all of the "describing data" standards of the Common Core Algebra Course using real data! Students will analyze various forms of tables & graphics to make inferences and interpret the data. The project is perfect for use as a summative assessment since students are required to justify their findings in open-ended format. Allow students to work in pairs, small groups, or individually! A grading rubric and selected
Subjects:
Grades:
8th - 11th
Types:
CCSS:
Also included in: Common Core Algebra 1 PROJECTS - BUNDLE PRICE!
AP Statistics
This AP Statistics curriculum bundle contains the following (please take time to preview video and/or individual item previews):Guided Notes and Graphic Organizers (EDITABLE)Exhibition stations (slides) with guided notes (EDITABLE)ActivitiesProjects (EDITABLE)Exams (EDITABLE)Teacher's pacing guide and suggested order for each unit Review in AP style for preparation for the APCOMING: powerpoint with guided notes for each of 9 units NEW! UNIT 1 and UNIT 2 slides and editable notes are currently in
Subjects:
Grades:
10th - 12th
CCSS:
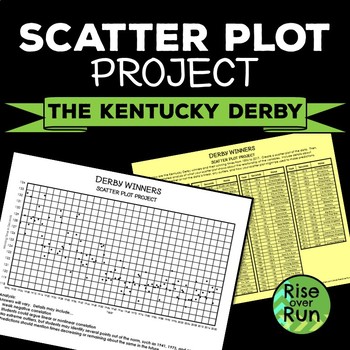
Scatterplot Project with Real World Stats from the Kentucky Derby
Practice creating and analyzing scatter plots with this project. Students are provided statistics for winning horses and must graph the data. Then, they write an analysis describing correlation, whether or not the data is linear, any outliers, and how the scatter plot might be used to make predictions. This is one of the projects in my Differentiated Scatter Plot Projects!Thank you for your interest in this resource from Rise over Run. Related Resources:Scatter Plot Practice WorksheetsScatter
Grades:
8th - 9th
Types:
CCSS:
Also included in: Algebra I Sub Plans Bundle with Activities
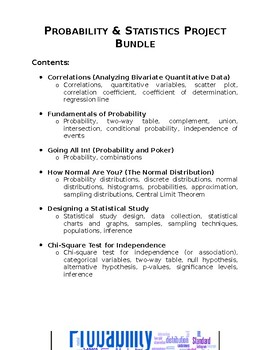
Probability & Statistics Project Bundle
A bundle that contains six different projects for a Probability & Statistics high school course. This bundle includes: Correlations (Analyzing Bivariate Quantitative Data) Fundamentals of Probability Going All In! (Probability, Combinations, and Poker) How Normal Are You? (The Normal Distribution) Designing a Statistical Study Chi-Square Test for Independence These projects are designed to engage students in authentic, hands-on, performance-based tasks. For each of these projects, students c
Subjects:
Grades:
9th - 12th
Types:
CCSS:

Statistics Survey Project - Project Based Learning (PBL) with Math
Watch your students dive into the world of math as they create, execute, and analyze their own survey! Students will demonstrate mastery of data gathering, survey sampling, developing appropriate survey questions, data tables, Direct Variation, discrete graphs, dot plots, box and whisker graphs, and calculating the inter-quartile range.The Unique Survey Project is highly engaging, capitalizing on the innate curiosity of the adolescent mind. You will love the low-prep instructional guide. Your st
Subjects:
Grades:
6th - 10th
Types:
Also included in: Fun with Ratios Activities Bundle - 7th Grade PBL with Math
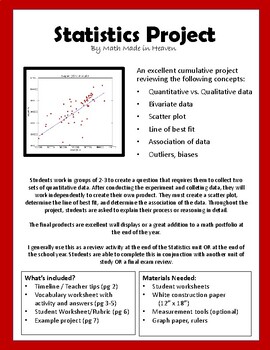
Statistics Project: scatter plot, line of best fit, association of data
An excellent cumulative project reviewing the following concepts: •Quantitative vs. Qualitative data•Bivariate data•Scatter plot•Line of best fit•Association of data (strong, weak, linear, non-linear, positive, and negative)•Outliers, biases, population, sample groupStudents work in small groups to create a question that requires them to collect two sets of quantitative data. After planning and conducting the experiment and collecting data, they will work independently to create their own produc
Subjects:
Grades:
7th - 10th
Types:
U.S. President -- Data Analysis & Statistics Inquiry - 21st Century Math Project
Engage students in data analysis through use of Presidential data in this 21st Century Math Project. Students will create box and whisker, stem and leaf, histograms and scatterplot through their investigations. In the end, students will take on the inquiry question: "Do US Presidents with the most children live longer after they have been inaugurated?" ***THIS PRODUCT HAS BEEN UPDATED WITH A GOOGLE SLIDES INTERACTIVE VERSION INCLUDED. REDOWNLOAD IF YOU HAVE IT ALREADY***-- In "He Entered a Youn
Subjects:
Grades:
6th - 12th
Types:
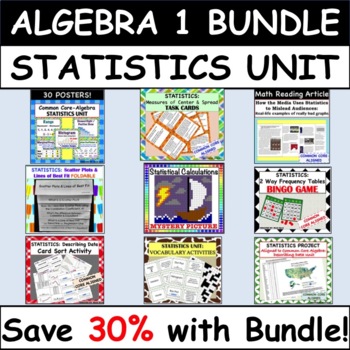
Common Core Algebra 1: STATISTICS UNIT - BUNDLE PRICE!
This Statistics Unit Bundle set includes a wide variety of 10 resources all geared towards the Common Core Algebra 1 course.Resources Included:Culminating Project Based on Real World Data30 PostersCard Sort ActivityMath Reading Article & Follow Up SummaryTask Cards ActivityFoldableMystery Color Picture Activity2 Vocabulary Activities including: Matching definition/vocabulary card set & crossword puzzleBingo GameLine of Best Fit - Class LabDifferentiation:Each resource in the bundle is di
Subjects:
Grades:
8th - 11th
Types:
CCSS:
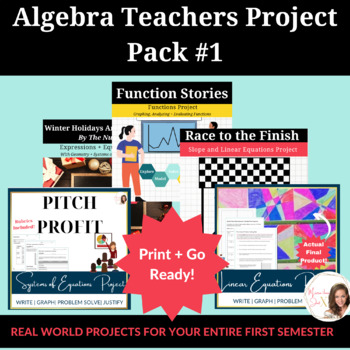
Algebra Teachers Project Pack #1
Get your hands on the Algebra Teachers Project Pack! With projects focusing on real world applications of:Functions and Function NotationGraphing and Writing Linear EquationsSlope and Linear FunctionsSystems of EquationsAlgebraic Operations and ReasoningEverything you need to crush your first semester of Algebra 1 and STOP hearing "When am I ever going to need this?!" The perfect introductory project pack to help you bring your math class to life and focus on building deep understanding of the c
Subjects:
Grades:
8th - 10th
Types:
CCSS:
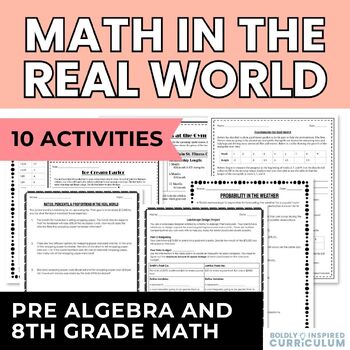
8th Grade Math Word Problems and Real World Math Projects Bundle | Pre Algebra
Challenge your students with this bundle of real world math projects and applications! Each word problem activity has a unique story or scenario that the students need to solve using their content knowledge and critical thinking skills. Topics include:✅ Ratios, proportions, and percents✅ Solving linear equations✅ Solving and graphing linear inequalities✅ Finding slope✅ Writing and graphing equations in slope-intercept form✅ Writing equations in standard form✅ Evaluating and graphing functions✅ S
Subjects:
Grades:
7th - 8th
Types:

Slope Project - Hands on Linear Equations Project - 8th Grade + Algebra
Race to the finish is NOT your average slope project! Are you ready for a hands on slope project that gets your students up and active? The Race to the Finish linear equations project will have your students ramped up as they work toward their race day expo! Phase 1: Students get hands on designing their ideal ramp and modeling it using graphs of linear equations.Phase 2: Students test and collect data to create a scatter plot and line of best fit to determine the best car to run down their trac
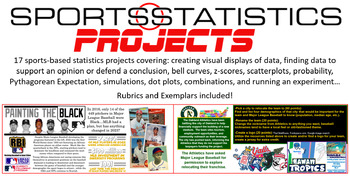
Sports Statistics - Projects ONLY! 17 projects in all
Most of the projects allow students to choose their own topic to display their understanding of statistical topics. Students will:Create a graph of their choosing given dataDesign an infographic on the subject of their choosingResearch and defend their G.O.A.T. choice in a variety of categoriesUse demographics to relocate and rebrand a professional franchiseResearch social injustices in sports and display the dataCreate a bell curve based on career statistics of Michael JordanCompare the salari
Subjects:
Grades:
8th - 12th
CCSS:
Showing 1-24 of 75 results

