80 results
Common Core HSS-ID.B.6 lessons
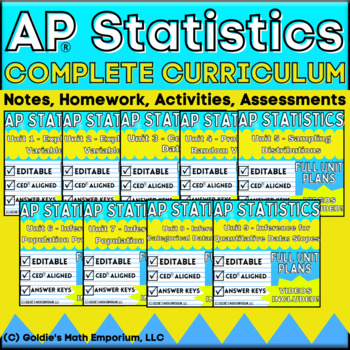
Goldie's FULL CURRICULUM for AP® Statistics
AP® Statistics Full CurriculumIn this product, you will receive all of Goldie's products related to AP® Statistics. All 9 units follow the College Board's© CED and include the following:Student Guided NotesStudent notes are "fill in the blank" style notes; teachers lead the lesson and work with students to complete the content. All content from the AP® CED is included and taught in the notes for this curriculum.Content VideosEach set of notes has a video to accompany it, where I teach the lesson
Subjects:
Grades:
10th - 12th
Types:
CCSS:
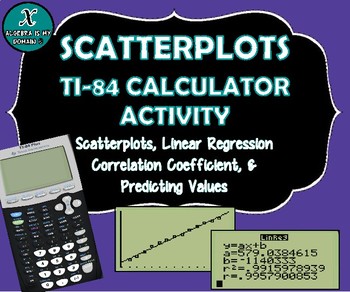
TI-84 CALCULATOR ACTIVITY - Data, Scatterplots, Regression & Line of Best Fit
This file includes four linear regression examples (all real-life data). The examples cover the following topics for the TI-84 graphing calculator:
* Creating a scatterplot
* Performing linear regression (finding the equation of the best-fit line)
* Interpreting the slope of the equation
* Calculating and interpreting the correlation coefficient
* Predicting values (using the linear regression equation)
The first example gives the step-by-step instructions to calculate all the necessary value
Subjects:
Grades:
7th - 12th, Higher Education
Types:
CCSS:
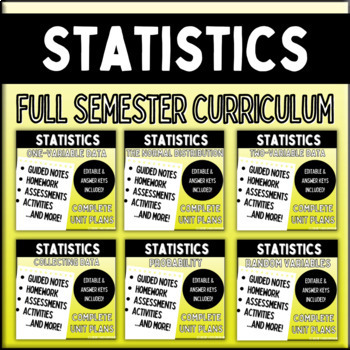
Statistics: FULL CURRICULUM BUNDLE
Statistics: Full Curriculum This is the FULL CURRICULUM bundle for my regular-level, Statistics course. If you are looking for my full curriculum for AP Statistics, follow the link here. This full curriculum is six units long and lasts 1 semester, approximately 90 school days. The following units are included in this bundle: Unit 1 – One-Variable DataUnit 2 – The Normal DistributionUnit 3 – Two-Variable DataUnit 4 – Collecting DataUnit 5 – ProbabilityUnit 6 – Random Variables Each unit contains
Subjects:
Grades:
11th - 12th
Types:
CCSS:
High School Data Analysis Project
This project covers a large range of data analysis methods. There are eleven total parts to the project.
Part One: the students have to collect data from 20 students outside of the classroom. Directions specify to ask students from each grade level.
Part Two: Measures of Center and Variation. Students will calculate mean, median, mode, range, and standard deviation for some of the data collected. Definitions of each term are included.
Part Three: Box-And-Whisker Plot. Students will create t
Subjects:
Grades:
9th - 12th
Types:
CCSS:
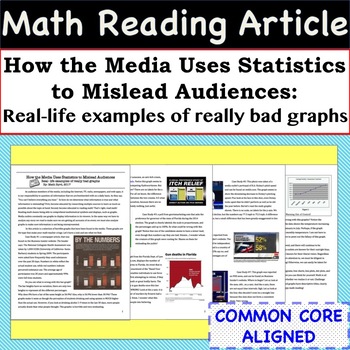
Statistics Math Article - Case Studies of Bad Graphs found in the Media
Incorporate Reading & Writing into the Math Classroom with this article and accompanying worksheet! The 4 page article is entitled - "How the Media Uses Statistics to Mislead Audiences: Real- life examples of really bad graphs". The worksheet helps students summarize the case studies and the article as a whole. This resource can be used in so many ways, some ideas are: station activity, independent reading assignment, small group activity, homework assignment, or whole class discussion.Skill
Subjects:
Grades:
8th - 11th
CCSS:
Also included in: Common Core Algebra 1 MATH READING ARTICLES - BUNDLE PRICE!
High School Math 1: ENTIRE YEAR BUNDLE!
This is a $144 dollar value!
This bundle includes absolutely everything you need to teach the entire High School Math 1 year-long 9th grade course. There are 10 full units included in this bundle purchase, including all developing tasks, solidifying notes, practice activities, and assessments. These are the units included in this purchase:
Unit 1: Geometry and Rigid Transformations
Unit 2: Statistics and Interpreting Data
Unit 3: Expressions and Equations
Unit 4: Compound Inequalities and Abso
Subjects:
Grades:
8th - 10th
Types:
CCSS:
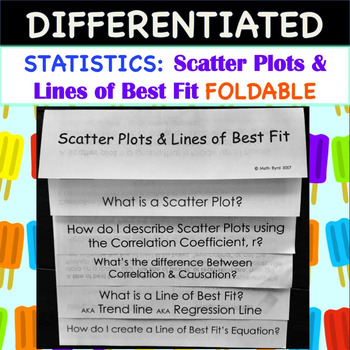
Statistics:Scatter Plots and Lines of Best Fit FOLDABLE
So Easy to Use! Simply print and fold! No need to rotate pages! Scatter Plots and Lines of Best Fit FOLDABLE also includes a PowerPoint to go along with the foldable.Foldable has 2 tiers of differentiation, perfect for the inclusive classroom! 1 set has fill-in-the-blank style notes within the foldable, while the other foldable has the notes already filled in. On both sets, students will have to work out the examples.Students will learn how to: Create Scatter PlotsDescribe Scatter Plots using Co
Subjects:
Grades:
8th - 11th
CCSS:
Also included in: Common Core Algebra 1: STATISTICS UNIT - BUNDLE PRICE!
Statistics: Two Variable Data
StatisticsUnit 3: Two-Variable Data Complete Unit Bundle that teaches scatterplots, correlation, linear regression, and more! Welcome! These are the complete unit plans for the third unit in my regular level Statistics class. If you are interested in the AP Statistics unit plans, check out my listing here. Included in this resource: 5 complete sets of student guided notes (annotated answer keys included)5 homework problem sets + complete test review (annotated answer keys included)2 assessments
Subjects:
Grades:
10th - 12th
Types:
CCSS:
Also included in: Statistics: FULL CURRICULUM BUNDLE
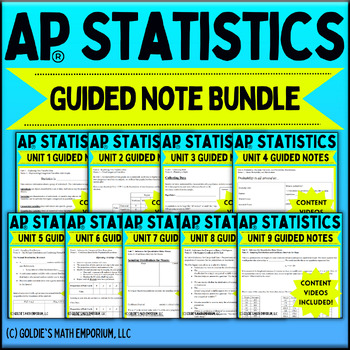
Goldie’s Guided Note Bundle for AP® Statistics
AP® StatisticsGuided Note BundleNote: If you have purchased individual Unit Plans or Goldie's FULL CURRICULUM for AP® Statistics, you already have these resources. You do NOT need to purchase this.Welcome! This is a bundle for all of my guided notes for all Units of AP Statistics. All of the resources are 100% editable, to modify to fit your classroom needs. The zip folder includes the Word document, which you have permission to edit completely. The PDF version and answer keys are included for y
Subjects:
Grades:
10th - 12th
Types:
CCSS:
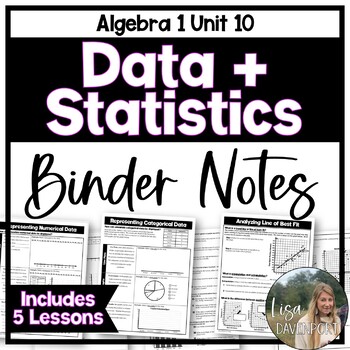
Data and Statistics - Editable Algebra 1 Binder Notes
This bundle includes editable binder notes and practice on 5 algebra 1 skills related to data and statistics. These notes provide the teacher and students with an organized set of guided notes and in class practice. Each topic includes 2 pages (1 page double-sided) of notes and examples. The following topics are included:Representing Univariate Numerical Data (using Line Plots, Histograms, and Box Plots)Representing Univariate Categorical Data (using Line Plots, Circle Graphs, and Bar Graphs)
Grades:
7th - 9th
CCSS:
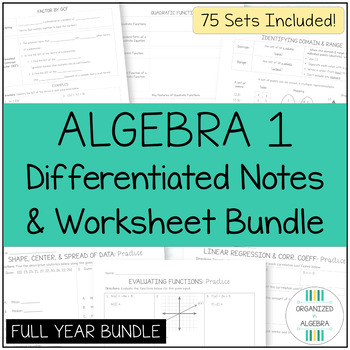
Algebra 1 Notes and Worksheets Full Year Differentiated Guided Notes
Enhance learning with these Algebra 1 Notes and Worksheets. This full-year set includes differentiated guided notes and worksheets, making algebra accessible for all students. Designed for diverse learning needs, it makes algebra accessible and engaging.Spend less time prepping and more time teaching effectively with this comprehensive resource.This Full Year Bundle includes 75 sets of notes and worksheets!Each set includes 3 versions of notes (Guided Notes, Blank Graphic Organizer & Filled
Grades:
9th - 10th
CCSS:
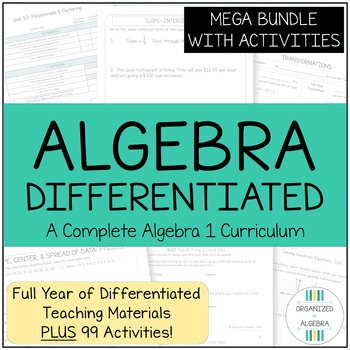
Algebra 1 Curriculum Full Year Differentiated Lessons Activities Assessments
Unlock student potential with our Algebra 1 Curriculum, differentiated for struggling learners. This full year program provides the support needed for success, making algebra manageable and accessible for every learner.Empower your students to succeed in algebra with a curriculum designed to meet their unique needs all year long.*This curriculum was designed to support students on or below grade level in Algebra 1 that have struggled in math. It includes many built-in differentiation options (do
Grades:
9th - 10th
CCSS:
Algebra 1 Curriculum Full Year Differentiated Lessons
Unlock student potential with our Algebra 1 Curriculum, differentiated for struggling learners. This full-year program provides the support needed for success, making algebra manageable and accessible for every learner.Empower your students to succeed in algebra with lessons designed to meet their unique needs all year long.*This curriculum was designed to support students on or below grade level in Algebra 1 that have struggled in math. It includes many built-in differentiation options (downloa
Grades:
9th - 10th
CCSS:
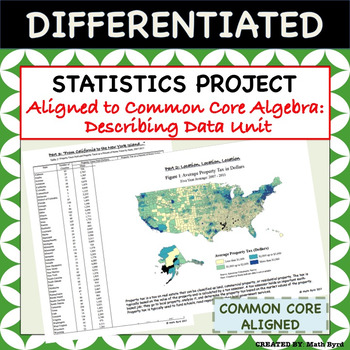
Statistics Project - Aligned to Common Core Algebra - Describing Data Unit
This differentiated U.S. Home Energy & Tax Themed Statistics Project covers all of the "describing data" standards of the Common Core Algebra Course using real data! Students will analyze various forms of tables & graphics to make inferences and interpret the data. The project is perfect for use as a summative assessment since students are required to justify their findings in open-ended format. Allow students to work in pairs, small groups, or individually! A grading rubric and selected
Subjects:
Grades:
8th - 11th
Types:
CCSS:
Also included in: Common Core Algebra 1 PROJECTS - BUNDLE PRICE!
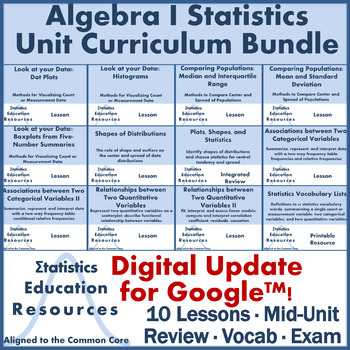
Bundle: Algebra 1 Statistics Unit Curriculum (Common Core)
UPDATE: Now includes lesson slides and editable worksheets for Google™ Slides and unit exam in Google™ Forms!Algebra I Statistics Unit BundleThis product is a bundle that includes 10 Common Core Aligned lessons, 4 statistics vocabulary lists (1 master list for the whole unit, and 3 smaller unit “sub lists”), 1 mid-unit integrated mini-review and worksheet (as homework or a quiz!), and 1 exam with answer key. Each lesson includes lecture slides with speaker notes, a handout, worksheet with answer
Subjects:
Grades:
8th - 11th
Types:
CCSS:
Algebra I: Statistics
Statistics Unit: Statistics introduces students to the fundamental concepts and tools necessary for collecting, analyzing, and interpreting data. This unit covers key topics such as measures of central tendency (mean, median, and mode), measures of dispersion (range, variance, and standard deviation), and the construction and interpretation of graphs such as histograms, box plots, and scatter plots and two way frequency tables. Students learn to apply these statistical tools to real-world data,
Grades:
8th - 9th
Types:
CCSS:
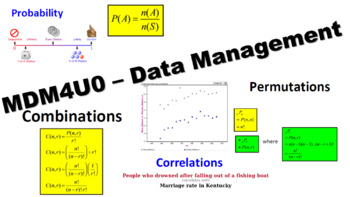
MDM4U - Grade 12 Math - Mathematics of Data Management - FULL COURSE!
This is my complete course package for the Grade 12 Data Management (MDM4U) course following the Ontario Secondary Mathematics Curriculum. This package includes:Smart Notebook and PowerPoint lessons with Student PDF versions for every lesson of every unit in the course. (I have also included versions with my notes for your use)A complete student workbook that covers every lesson in the course. Each lesson concludes with appropriate workbook sections, so you can use whatever textbook you want!App
Subjects:
Grades:
12th
CCSS:

Two Variable Data Lesson, Project, and Activities: Scatter Plots, Regressions
Hi!This bundle includes the full lesson for two-variable data and activities to supplement the lesson. It also includes a full project and a graphic organizer for students to use throughout the chapter to supplement their learning on scatter plots, regression lines, and correlation. Please see each individual activity/resource for a more in-depth description of each. This lesson covers regression lines, scatter plots, correlation, and how each are changed depending on outliers/new additions to d
Subjects:
Grades:
10th - 12th
Types:
CCSS:
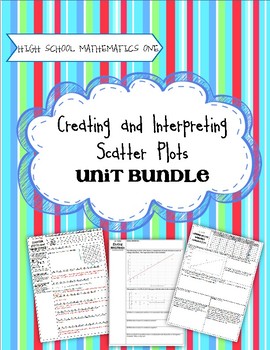
High School Math 1: Scatter Plots and Correlation
Task-Based Learning gets students intrinsically motivated to learn math! No longer do you need to do a song and dance to get kids interested and excited about learning. The tasks included in this unit, followed by solidifying notes and practice activities, will guarantee that students understand the concepts. This unit will effectively teach how to create and interpret scatter plots, calculate a linear model for best fit, calculate a correlation coefficient, and how to use a residual to deter
Subjects:
Grades:
8th - 10th
Types:
CCSS:
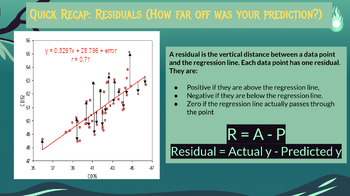
Lesson 3: Two Variable Data: Statistics (correlation, regressions, scatter plot)
Hello!This is a lesson (powerpoint) on two-variable data. It includes vocabulary and guided practice on how to create scatter plots, calculate and interpret correlation, and write regression lines. This lesson should span through two weeks. You can find supplementary activities to this lesson on my storefront! If you teach StatsMedic, it's aligned to the cadence of StatsMedic lessons and activities. This resource is best downloaded to Google Drive and then edited as needed for your students. Ple
Subjects:
Grades:
10th - 12th
Types:
CCSS:
Introduction to Functions | Unit with Videos
Each lesson in this Introduction to Functions Unit is taught via video with accompanying notes, practice, review, and assessments. This unit teaches the following concepts:* Graphing Relationships * Relations & Functions* Functional Notation * Graphing Linear Equations * Intercepts * Direct Variation * Scatter PlotsThis unit includes: * Video lessons that teach each concept in a way students can easily understand * Guided student notes that keep students engaged, hold them accountable, and s
Grades:
8th - 9th
Types:
CCSS:
Also included in: Algebra 1 Curriculum with Videos + ACTIVITIES Bundle
Lesson: Linear Regression, Residuals, Correlation vs. Causation (Common Core)
UPDATE: Now includes lecture and worksheet with editable features for Google Slides™ !Relationships between Two Quantitative Variables: Linear Regression Models, and Correlation vs. Causation (Common Core Aligned Lesson) This product includes a lesson plan with worksheet and answer key aligned with the common core. Students review how represent the relationship between two quantitative variables on a scatterplot. Students learn how to fit and interpret linear regression models; how to compute a
Subjects:
Grades:
8th - 12th
Types:
CCSS:
Also included in: Bundle: Algebra 1 Statistics Unit Curriculum (Common Core)
Data Analysis and Statistics Guided Notes (Algebra 2 - Unit 13)
Data Analysis & Statistics Guided Notes Bundle:Your Algebra 2 Honors students will have a set of Guided Student Notes plus Google Slides and a Warm-Up exercise with Video Lessons for each section to meet your flipped classroom or distance learning needs and a complete solution set for lessons covering the topics and concepts for Data Analysis & Statistics. Teachers also have a fully-editable pacing guide with topics and standards for your planning needs.Guided Notes Format:The unit is o
Subjects:
Grades:
8th - 11th, Higher Education
Types:
CCSS:
Also included in: Algebra 2 Curriculum Big Bundle | Flamingo Math
Statistics:Scatter Plots and Lines of Best Fit MYSTERY ACTIVITY
In this fun activity students will solve the mystery of the stolen art by collecting data on classmate's standing long jump and height. Students will create a scatter plot and line of best fit for their data; then use their data to make predictions for the 5 suspects. Students will create a one page investigate report to discuss their procedure of investigation, their conclusion, and the strength of their conclusion by interpreting the correlation coefficient. Skills Used:Measure using RulersCon
Subjects:
Grades:
8th - 11th
Types:
CCSS:
Also included in: Common Core Algebra 1: STATISTICS UNIT - BUNDLE PRICE!
Showing 1-24 of 80 results

