28 results
Common Core HSS-ID.B.6 interactive notebooks
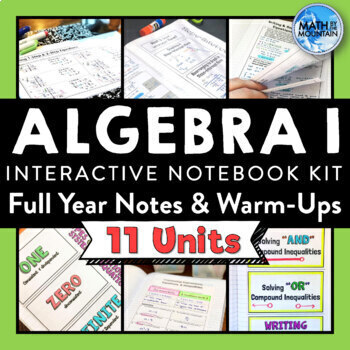
Algebra 1 Notes Interactive Notebook | Full Year Notes & Warm-Ups BUNDLE
This resource has it all with a full year of Algebra 1 notes, warm-ups, and pacing guides so you can confidently teach Algebra 1 without all of the hassle and time of making it yourself. Complete answer keys are always included. Additional bonus files are provided so you can get an easy start to using interactive notebooks, too! If you want to get all of my Algebra 1 interactive notebook kits in one place for the biggest discount, look no further, this bundle is for you! ⭐ Searching for print &a
Grades:
7th - 10th
CCSS:
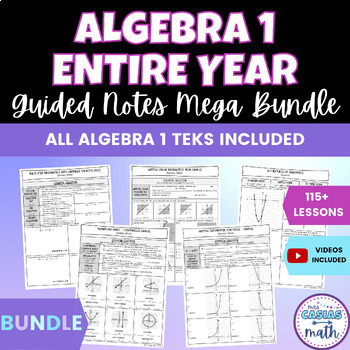
Algebra 1 Guided Notes Lessons Mega Bundle Entire Year
Are you looking for ready to go Algebra 1 lessons for the entire year? Get all of these Algebra 1 guided notes (116 lessons) for the lowest price in this bundle! These notes were built to align with the Algebra 1 TEKS, but many lessons align to CCSS and other standards as well. Each no-prep guided notes lesson comes out to less than $1/piece in this bundle! These notes get straight to the point of the skill being taught, which I have found is imperative for the attention span of teenagers! They
Subjects:
Grades:
7th - 9th
CCSS:
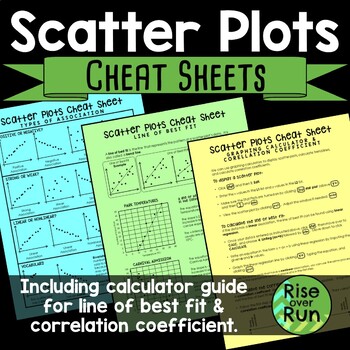
Scatter Plot Cheat Sheets Printable Guided Notes
Detailed sheets for the following topics: •Types of Association & VocabularyThis page shows examples of positive, negative, strong, weak, linear, and nonlinear association. It also shows clusters and outliers.•Line of Best FitThis page explains what a line of best is (or trend line) along with examples and nonexamples. It has 2 real world connections and how to interpret the line of best fit.•Graphing Calculator Guide & Correlation CoefficientThis sheet gives step by step instructions fo
Subjects:
Grades:
8th - 9th
CCSS:
Also included in: 8th Grade Math Activities & Lessons Bundle for the Whole Year
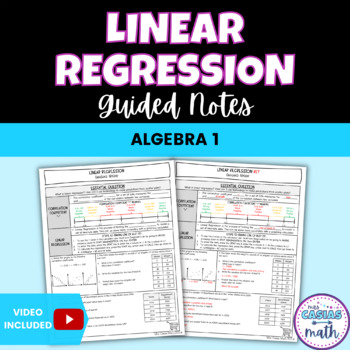
Linear Regression and Correlation Coefficient Guided Notes Lesson Algebra 1
This concise, to the point and no-prep linear regression lesson is a great way to teach & introduce how find the correlation coefficient and line of best fit with technology to your students. These notes go over the steps to using linear regression on a TI-84 calculator and include 3 in-depth examples with multiple parts where students find & interpret the correlation coefficient & line of best fit. Students and teachers love how easy these notes are to follow and understand. These n
Subjects:
Grades:
8th - 9th
CCSS:
Also included in: Linear Equations and Inequalities Algebra 1 Guided Notes Lessons BUNDLE
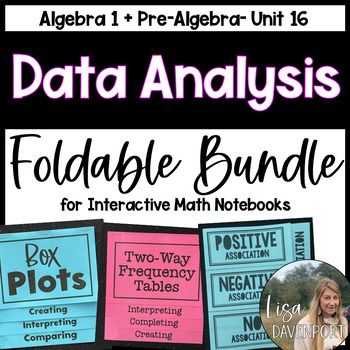
Data Analysis and Statistics Foldable Bundle
This foldable bundle includes skills associated with data and statistics taught within middle school math or algebra 1 standards:Mean, Median, Mode, RangeComparing CentersBox PlotsDot PlotsDisplaying Numerical DataAssociation within Scatter PlotsScatter PlotsWriting an Equation for a Trend LineStandard Deviation + The Empirical RuleData + Statistics in Algebra 1 Overview (Dot Plots, Histograms, Box Plots, + Two-Way Frequency TablesDetailed answer keys are included for each foldable.All of these
Grades:
7th - 10th
CCSS:
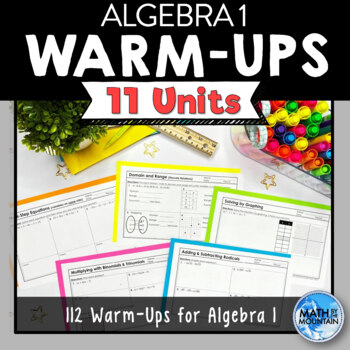
Algebra 1 Warm-Ups Full Year Bundle
Algebra 1 students need repetition to really master a concept. Recap warm-ups, also known as "bell-ringers" or "do now's," are the perfect way to start class every day and boost student achievement. Reasons to incorporate this into your classroom routine:They make it so much easier to catch and correct misconceptions that may have developed which helps to take student learning from half-baked to fully-doneThey give students another chance to ask questions about their learning from the prior dayS
Grades:
7th - 10th
CCSS:
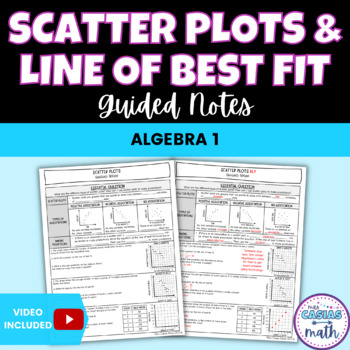
Scatter Plots and Line of Best Fit Guided Notes Lesson Algebra 1
This concise, to the point and no-prep scatter plots lesson is a great way to teach & introduce how to write the line of best fit to your students. These notes go over types of associations from scatter plots, and how to make predictions from scatter plots by writing the equation for the line of best fit without technology. There are 3 in-depth examples with multiple parts where students practice writing the line of best fit with two points from the line and use it to predict. Students and t
Subjects:
Grades:
8th - 9th
Also included in: Linear Equations and Inequalities Algebra 1 Guided Notes Lessons BUNDLE
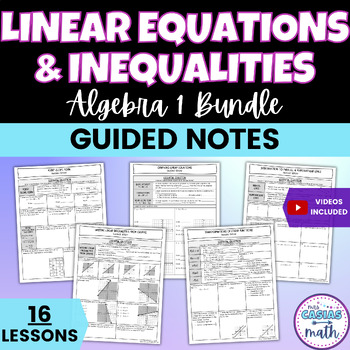
Linear Equations and Inequalities Algebra 1 Guided Notes Lessons BUNDLE
This bundle includes 16 different Algebra 1 lessons over linear equations and inequalities. These notes provide fantastic scaffolding by starting out with finding slope from linear equations in various forms, then move into point slope-form and standard form equations, parallel and perpendicular lines, linear inequalities, and end with scatter plots and linear regression. These lessons provide a variety of practice for students with simple skills-based problems all the way through real world app
Subjects:
Grades:
8th - 9th
CCSS:
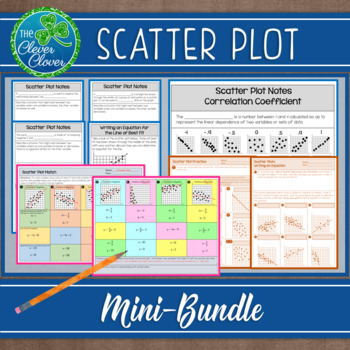
Scatter Plot Mini-Bundle
This resource includes six half pages of notes that are perfect for interactive notebooks. The first three pages introduce students to positive, negative and no correlation scatter plots. Students are asked to describe real world situations that might exist for each type of correlation. Students will graph three different sets of data in order to visualize the different types of scatterplots. Definitions for the line of best fit and correlation coefficient are provided. Each one of the half p
Subjects:
Grades:
6th - 9th, Adult Education
CCSS:
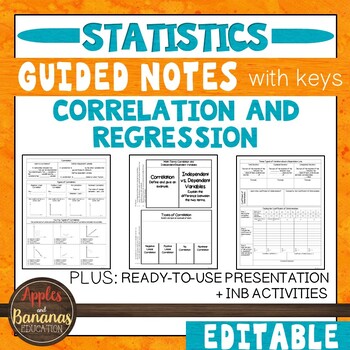
Correlation and Regression - Guided Notes, Presentation, and INB Activities
This Correlation and Regression (Statistics) product is flexible, editable, and can be used for in-person or distance learning. It includes guided notes embedded with student practice problems (keys included), foldable activities, and a PowerPoint presentation for focused instruction. Choose what works best for your class/student and modify to make the content fit your needs. Notes are designed to clearly present the topics and reach all types of learners. Take the time and stress out of creatin
Subjects:
Grades:
9th - 12th
CCSS:
Also included in: Custom Bundle for Viet
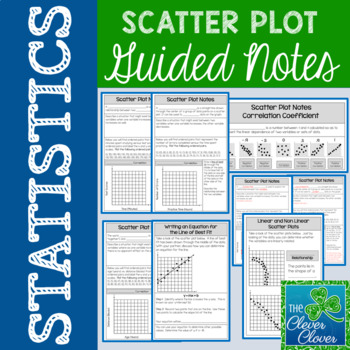
Scatter Plot Notes
This resource includes six half pages of notes that are perfect for interactive notebooks. The first three pages introduce students to positive, negative or no correlation scatter plots. Students are asked to describe real world situations that might exist for each type of correlation. Students will graph three different sets of data in order to visualize the different types of scatterplots. Definitions for the line of best fit and correlation coefficient are provided. Each one of the half pa
Subjects:
Grades:
6th - 9th, Adult Education
Types:
CCSS:
Also included in: Scatter Plot Mini-Bundle
Constructing Scatter Plots Digital Notes & 2 Quizzes (GOOGLE) (Distance Learning
Product DescriptionGoogle Slides Digital Interactive Notes. The notes are everything beneficial of an interactive notebook without all the paper, glue, scissors, etc.Content:Students will be able to construct scatter plots given a set of data. Students will be able to identify positive correlation, negative correlation, and no correlation. Includes:Google Slides: Constructing Scatter Plots Digital NotesGoogle Forms: Self Grading Quick Check Quiz 1 & Self Grading Quick Check Quiz 2Answer KeyT
Subjects:
Grades:
6th - 9th
Types:
CCSS:
Also included in: 8th Grade Math Digital Notes GROWING BUNDLE (Distance Learning)
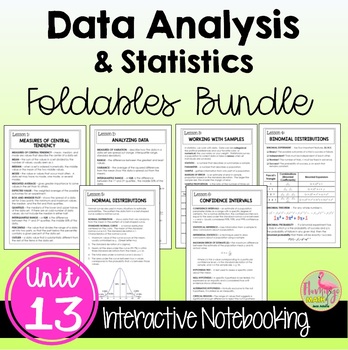
Data Analysis and Statistics FOLDABLES™ (Algebra 2 - Unit 13)
This bundle of 8-page Bound-Book-Style Foldables includes six lessons on topics in UNIT 13: Data Analysis & Statistics for your Algebra 2 Honors students. A set of finished notes and directions for creating the Foldables are also included.⭐ Bonus: A set of Google Slides for presenting the lesson and video lesson links are now included for distance learning and flipped classroom methods.☆FOLDABLESThree options of an 8-page Bound-Book Foldable® will help with differentiation.Option #1: All voc
Subjects:
Grades:
8th - 11th, Higher Education
CCSS:
Also included in: Algebra 2 Curriculum Big Bundle | Flamingo Math
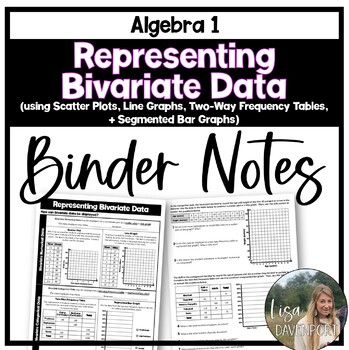
Representing Bivariate Data - Binder Notes for Algebra 1
This set of algebra 1 binder notes provides the teacher and students with guided notes on bivariate numerical and categorical data representations, including: scatter plots, line graphs, two-way frequency tables, and segmented bar graphs. Please note: This is a very broad overview of each of these 4 types of graphs. The front side of the notes focus on constructing each of them and the back side also has students analyze and compare the types of graphs. This would serve as a fantastic introd
Subjects:
Grades:
7th - 9th
CCSS:
Also included in: Algebra 1 Editable Binder Notes Bundle for the Entire Year
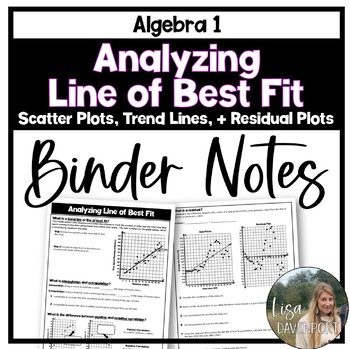
Analyzing Line of Best Fit - Binder Notes for Algebra 1
This set of algebra 1 binder notes provides the teacher and students with guided notes on trend lines and line of best fit. Students will explore scatter plots, write a trend line, interpolate, extrapolate, distinguish between positive and negative correlation, and compare scatter plots to their corresponding residual plot. This 2-page document covers many different concepts; therefore, really only provides a brief overview and one example of each. This resource is included in the following b
Subjects:
Grades:
7th - 9th
CCSS:
Also included in: Algebra 1 Editable Binder Notes Bundle for the Entire Year
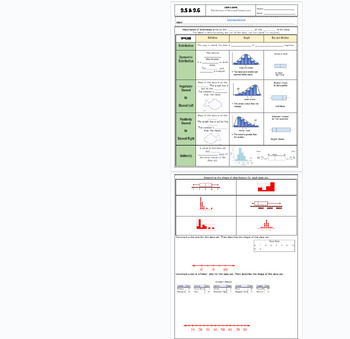
Data Distribution positive/negative skewed fillable notes UPDATED
Unit 9: Data and Stats: Updated(No 9.3/ Skip)9.5/9.6 Data Distribution (skewness)Students go over the vocabulary and complete the examples with the vocabulary scaffolded. Skewness is explained and how to identify it comparing data charts and box and whisker plots. Uses many visuals and examples to differentiate between that different graphs. Notes are scaffolded. Includes hook video hyperlinked on the "learning objective" title. Key is included and hyperlinked as a PDF in the heading highlighted
Subjects:
Grades:
6th - 12th, Higher Education, Adult Education
CCSS:
Also included in: Unit 9: Data and Statistics Fillable Notes
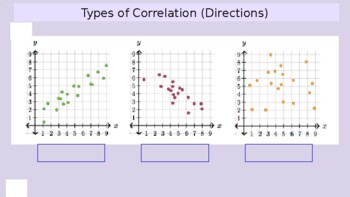
Correlation Coefficient Notes - Scale of r with accompanying scatter plot graphs
Clear notes about the correlation coefficient shown on a scale so students can see both strength, the scatter plot, and the direction all in one.
Subjects:
Grades:
6th - 9th
CCSS:

Survey Project - Digital Google Slides Assignment
This project requires students to:- Create a numerical and categorical statistical question- Predict and hypothesis the results they will receive- Think about how they will set up and send out their survey- Survey 25 individuals and interpret their results. - Calculate Mean and Standard Deviation- Create charts on Google Sheets- Discuss results- Discuss possible improvementsThis project could take up to a week for students to complete depending on how you set it up in your classroom.One thing yo
Subjects:
Grades:
7th - 12th
CCSS:
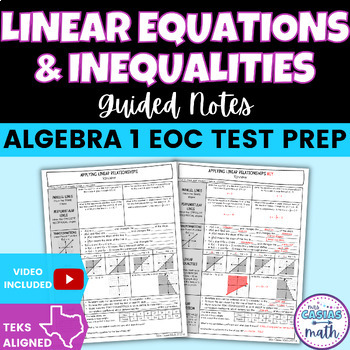
Linear Equations and Inequalities Algebra 1 STAAR EOC Test Review Sheet
Are you looking for Algebra 1 state test prep review sheets? You will find that here with this concise, to the point and no-prep Linear Equations and Inequalities STAAR EOC Review Guided Notes Lesson! This Algebra 1 goes over parallel and perpendicular lines, transformations of linear functions, linear inequalities and linear regression. Students and teachers love how easy these notes are to follow and understand. These notes get straight to the point of the skill being taught, which I have foun
Subjects:
Grades:
8th - 9th
CCSS:
Also included in: Algebra 1 STAAR EOC Review Sheets BUNDLE

Line of Best Fit - (Guided Notes and Practice)
Line of Best Fit.This document contains three pages of guided notes and two pages of guided practice. This is a great resource for an introductory/intermediate/advance lesson on the line of best fit
10 pages - (Guided Notes, Practice and Answers)
IMPORTANT: FOR BEST RESULTS, PRINT IN COLOR AND THEN COPY IN BLACK AND WHITE.
Borderless Printing Instructions
Open PDF -> File -> Print -> Properties -> Page Setup -> Borderless -> Ok -> Print
Subjects:
Grades:
7th - 12th
CCSS:
Measures of Center - EDITABLE Slides, Notes, INB & Test+++ Drive Math
Drive Instruction with instructional resources that live in the cloud on Google Drive! All of the docs are COMPLETELY EDITABLE and can be differentiated to meet your needs or the needs of your students. PDFs are also included in the download if you prefer them that way. Each Drive Instruction set includes warm-ups, exit tickets, notes, presentations, digital interactive notebooks and tests. These are designed to be complementary to all of my innovative supplemental resources and an improvement o
Subjects:
Grades:
6th - 10th
Also included in: Measures of Center & Variance Unit Bundle - Distance Learning Compatible
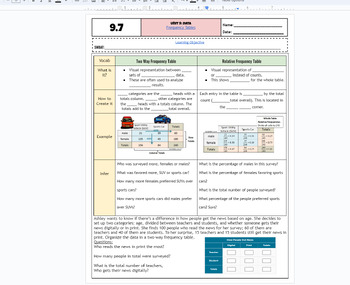
Frequency Tables & Relative Frequency Tables fillable notes UPDATED
Unit 9: Data and Stats: Updated(No 9.3/ Skip)9.7 Frequency Tables Students go over the vocabulary and complete the examples with the vocabulary scaffolded. Students examine a categorical table/frequency table and also use that information to create relative frequency tables. Different real-world examples and problems are used. Emphasized how percents and decimals are calculated. Notes are scaffolded. Includes hook video hyperlinked on the "learning objective" title. Key is included and hyperli
Subjects:
Grades:
6th - 12th, Higher Education, Adult Education
CCSS:
Also included in: Unit 9: Data and Statistics Fillable Notes

Scatter Plot - (Guided Notes and Practice)
Scatter plot.This document contains two pages of guided notes and one page of guided practice. This is a great resource for an introductory/intermediate lesson on scatter plots.
6 pages - (Guided Notes, Practice and Answers)
IMPORTANT: FOR BEST RESULTS, PRINT IN COLOR AND THEN COPY IN BLACK AND WHITE.
Borderless Printing Instructions
Open PDF -> File -> Print -> Properties -> Page Setup -> Borderless -> Ok -> Print
Subjects:
Grades:
7th - 12th
CCSS:
Linear Relationships: Scatter Plots (Linear Regression) - 100+ Slides
These lessons focus on how to read, create and analyze scatter plots. Students use what they already know about linear equations to determine the line of best and use their graphing calculators to determine the correlation coefficient. These lessons includes step-by-step animated lesson notes and practice problems. The slides are fully editable for you and your student's needs. You can pick and choose the slides you need, use other slides for reteaching, duplicate slides and modify them as nee
Grades:
8th - 12th
CCSS:
Showing 1-24 of 28 results

