86 results
Common Core HSS-ID.B.6 printables
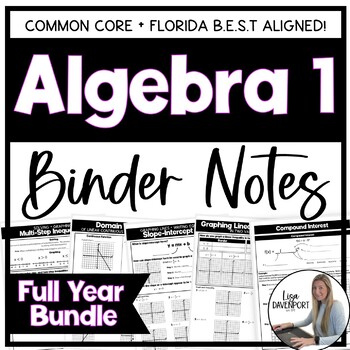
Algebra 1 Editable Binder Notes Bundle for the Entire Year
This bundle currently includes fully editable binder notes with built-in practice for 55 algebra 1 skills (+8 pre-requisite skills). These notes provide the teacher and students with an organized set of guided notes and plenty of in class practice. Each topic includes 2 pages (1 page double-sided) of notes and examples. Below you will find the units and topics included. Click on each unit bundle or individual lesson for a more in depth look at the resources included.Please send me a Q+A or f
Subjects:
Grades:
8th - 9th
CCSS:
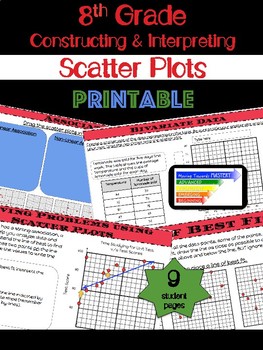
8th Grade Math Constructing & Interpreting Scatter Plots
Extensive printable lessons for constructing and interpreting scatter plots.The lessons are scaffolded to build understanding. Students will progress from identification of terms to making predictions involving bivariate data. The guided lessons will begin with identification, move towards assisted analysis, and conclude with independent practice.Lessons include...♦ Definitions and Visual Representations♦ Identification and Use of Terms → Bivariate Data → Scatter Plot → Linear, Nonli
Subjects:
Grades:
8th - 10th
Types:
CCSS:
Also included in: 8th Grade Math Common Core Growing Bundle
NC Math 1 *PRACTICE LIKE A CHAMPION* Complete Bundle (552 EOC Aligned Items)
This bundle includes practice items for ALL 46 NC Math 1 state standards - 12 items per standard for a total of 552 practice EOC items in all.Perfect for end of semester review and practice for the NC Math 1 EOC or to usethroughout the course to assess student understanding on any standard at any time. Since the items are grouped by standard, they are perfectly organized for analyzing student data!Each standard's item set is also available individually in my TpT store, along with a full length P
Subjects:
Grades:
7th - 10th
Types:
CCSS:
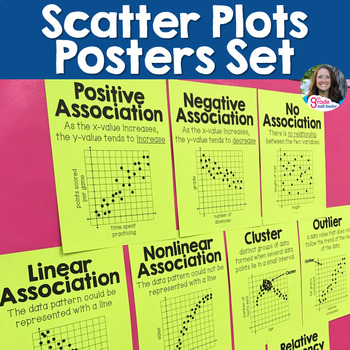
Scatter Plots and Two Way Tables Posters Set for 8th Grade Math Word Wall
Make the vocabulary visible and accessible for your students! This set of 12 printable vocabulary posters provides visuals and reminders for your students to reference during your Bivariate Data unit. Display these on your word wall while teaching scatter plots and two-way tables!The following vocabulary terms are included:scatter plotpositive association or positive correlationnegative association or negative correlationno association or no correlationlinear associationnonlinear associationoutl
Subjects:
Grades:
8th - 9th
Types:
CCSS:
Also included in: 8th Grade Math Vocabulary Posters for Word Wall - Full Year
NC Math 1 Practice End-of-Course Test (North Carolina EOC Final Exam Review)
This full length 60-item multiple choice practice test is aligned to the North Carolina Standards for Math 1. It includes 16 non-calculator active questions and 44 calculator active questions. An answer key and item/standard alignment is included for easy data analysis.
Subjects:
Grades:
7th - 10th
Types:
CCSS:
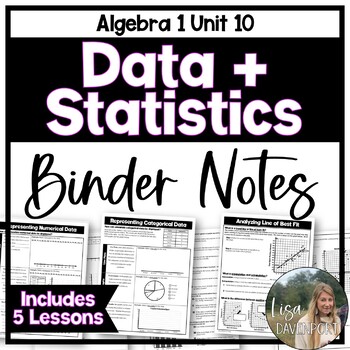
Data and Statistics - Editable Algebra 1 Binder Notes
This bundle includes editable binder notes and practice on 5 algebra 1 skills related to data and statistics. These notes provide the teacher and students with an organized set of guided notes and in class practice. Each topic includes 2 pages (1 page double-sided) of notes and examples. The following topics are included:Representing Univariate Numerical Data (using Line Plots, Histograms, and Box Plots)Representing Univariate Categorical Data (using Line Plots, Circle Graphs, and Bar Graphs)
Grades:
7th - 9th
CCSS:
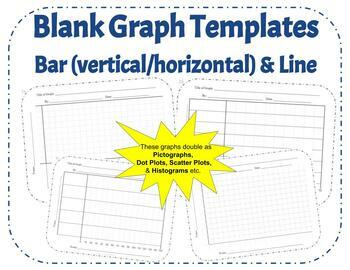
42 Blank Graph Templates: Horizontal & Vertical Bar Graph, Line Graph, Printable
Looking for an array of printable graph templates for all your future bar and line graph needs? Look no further! With 42 different templates ranging for bar graphs, to line graphs, varying in X values and Y values, this combination should be the last graph download you need to worry about for your class. These graphs can even be used as Histograms, Dot Plots, Scatter Plots, or a variety of other graphs to suit the needs of your classroom.I created this template to require all the basics of gr
Grades:
4th - 12th
Types:
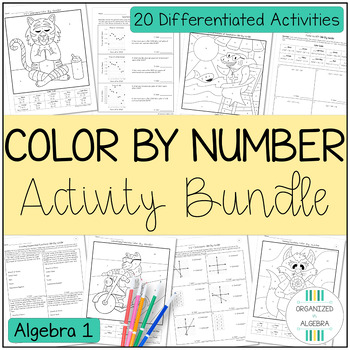
Algebra 1 Differentiated Color By Number Activity Bundle
These no prep, differentiated color by number activities give your students an engaging way to practice Algebra 1 topics at the level they are ready for!These resources save you the time and effort of creating additional versions of activities to meet your students' needs. It's done for you! Each topic comes with 2 versions that both lead to the same final image.How It Works: Students will answer questions, find their answer in the color code (this makes it self-checking!), and color the image a
Grades:
9th - 10th
Types:
CCSS:
High School Math Performance Tasks Bundle
Performance Tasks are high-interest activities with real world math application. These are a great way to supplement your instructional tools to engage your students, develop critical thinking skills and make connections to the real world.
Now you can save time and money with this collection of High School Performance Tasks! This easy to manage bundle includes 66 Performance Tasks, which cover 100% of Topics for High School, and an index so you can quickly find a Performance Task that covers wh
Subjects:
Grades:
9th - 12th
Types:
CCSS:
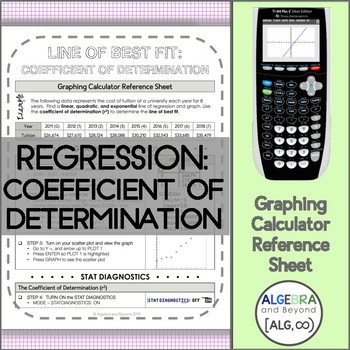
Linear, Quadratic, and Exponential and Coefficient of Determination | TI-84
This graphing calculator reference sheet shows students how to find the lines of regression for linear, quadratic, and exponential functions and determine the line of best fit using the coefficient of determination on the Ti-84 graphing calculator.Teaching graphing calculator skills to help students with: • Speed• Making connections• Checking for accuracy• Leaping hurdles*Reference sheets can be used with a TI-84 or Ti-83 graphing calculator. Please look at the preview to find out more informati
Subjects:
Grades:
9th - 12th
Types:
CCSS:
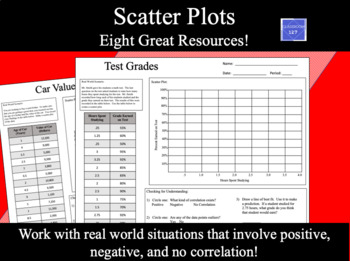
Scatter Plots Worksheets
This product provides students with a great opportunity to practice creating and reading scatter plots.This product containsThree real world scenarios that have students creating and reading scatter plots that have a positive correlation.Three real world scenarios that have students creating and reading scatter plots that have a negative correlation.One real world scenario that have students creating and reading a scatter plot that has no correlation.One blank template that allows students to ga
Subjects:
Grades:
7th - 9th
Types:
CCSS:
Also included in: 8th Grade Math Resources MEGA Bundle
Interleaving Algebra 1 - 2024
Interleaving means mixing up the ideas and concepts and bringing back older content regularly to help students remember what they have learned and apply what they have learned as they are learning new content.This resource contains 16 sets of 16 questions (total of 256 items) that interleave the concepts of Algebra. The depth of knowledge (DOK) level starts lower and gradually builds. The last item sets are as rigorous as those you may encounter on an Algebra 1 state assessment.There are a vari
Subjects:
Grades:
7th - 10th
Types:
CCSS:
Algebra 1 End of Year EOC Review - Test Prep Quizzes
My Algebra 1 End of Year EOC Review includes 8 comprehensive test prep quizzes that cover almost all of the Algebra 1 standards. Key Features:Each quiz contains between 15 to 23 questions, culminating in 138 total Algebra 1 review questionsMostly multiple choice questions to reflect a typical EOC Algebra 1 exam format, but there are some free-response questions as well to challenge students furtherCertain multi-part questions to ensure the most efficient and effective review of key conceptsI als
Subjects:
Grades:
8th - 10th
Types:
CCSS:
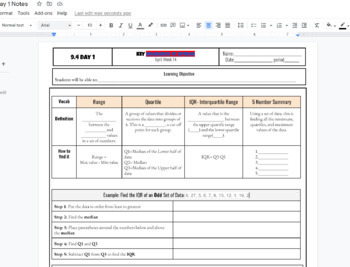
IQR interquartile Range and 5 number summary box and whisker plot Notes
IQR interquartile Range and 5 number summary box and whisker plot Notes including Q1, Q2, Q3, Min and Max and step by step both examples of finding the IQR and creating a box and whisker plot. Used in HS math 1 class WITH KEY INCLUDED AS a link to a printable PDF
Subjects:
Grades:
7th - 12th, Higher Education, Adult Education
CCSS:
Math I End of Course Exam TEST PREP package
Math I End of Course Exam Test Prep packageIncludes 10 individual practice "lessons" that each contain 10 problems.Each practice lesson includes both a Calculator Inactive portion and a Calculator Active portion.The included Performance Chart allows for students to keep track of their progress as they strive to make improvement as they progress through the 10 lessons. I suggest providing each student a copy of the Performance Chart on colored paper to keep and record progress.The specific imple
Subjects:
Grades:
8th - 10th
CCSS:
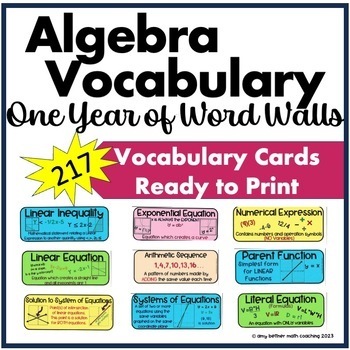
Algebra 1 Word Wall BUNDLE Common Core Aligned
Are your students struggling to remember Algebra vocabulary words and their definitions? Do you need pictures and models of the most important algebra vocabulary for your students? These math vocabulary word cards are the perfect solution! You can print and laminate this ENTIRE YEAR of Algebra words, and post them on your classroom bulletin boards for students to see all year round!This entire year of algebra vocabulary cards will help your students have a visual aid every day to look at and re
Subjects:
Grades:
8th - 10th
Types:
CCSS:
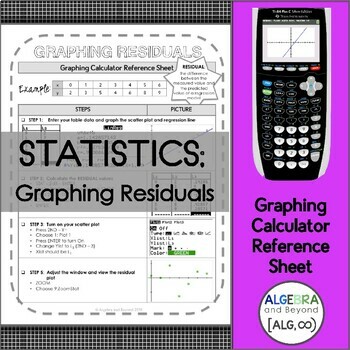
Residuals | Statistics | TI-84 Graphing Calculator Reference Sheet
This graphing calculator reference sheet guides students step by step with visuals on how to graph residual plots.*Important: this sheet does NOT teach them how to graph a scatter plot or a line of regression. If students need these steps, please also purchase the Linear Regression graphing calculator reference sheet to accompany the residual sheet.Teaching graphing calculator skills to help students with: • Speed• Making connections• Checking for accuracy• Leaping hurdles*Reference sheets can b
Subjects:
Grades:
10th - 12th
Types:
CCSS:
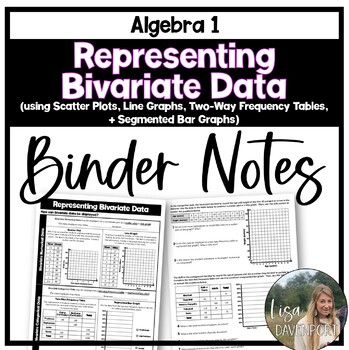
Representing Bivariate Data - Binder Notes for Algebra 1
This set of algebra 1 binder notes provides the teacher and students with guided notes on bivariate numerical and categorical data representations, including: scatter plots, line graphs, two-way frequency tables, and segmented bar graphs. Please note: This is a very broad overview of each of these 4 types of graphs. The front side of the notes focus on constructing each of them and the back side also has students analyze and compare the types of graphs. This would serve as a fantastic introd
Subjects:
Grades:
7th - 9th
CCSS:
Also included in: Algebra 1 Editable Binder Notes Bundle for the Entire Year
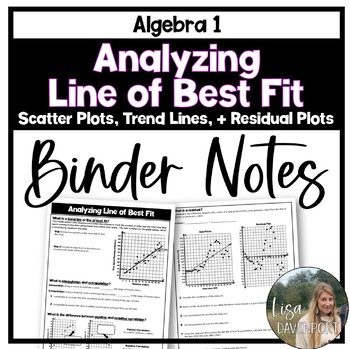
Analyzing Line of Best Fit - Binder Notes for Algebra 1
This set of algebra 1 binder notes provides the teacher and students with guided notes on trend lines and line of best fit. Students will explore scatter plots, write a trend line, interpolate, extrapolate, distinguish between positive and negative correlation, and compare scatter plots to their corresponding residual plot. This 2-page document covers many different concepts; therefore, really only provides a brief overview and one example of each. This resource is included in the following b
Subjects:
Grades:
7th - 9th
CCSS:
Also included in: Algebra 1 Editable Binder Notes Bundle for the Entire Year
Algebra 1 Warm-Ups Bundle: Math Bell Ringers on Basic Algebra Skills Sets 1 – 4
Develop those critical Algebra skills and enrich your curriculum with this supplement! Uncover areas of strength and weakness! Review and, if necessary, reteach essential algebra skills using the detailed solutions written with your students in mind! Teachers can use these practice problems to assess students’ knowledge and mastery of these essential algebra skills AND prepare for standardized tests. This bundle includes the exercises from all four sets of our Algebra warm ups: Set 1 Pre-Algeb
Subjects:
Grades:
7th - 10th
Types:

8th Grade Bivariate Data Worksheets With Answers | 8th Grade Math
DescriptionThese 8th-grade Bivariate Data Worksheets are perfect for classroom use or home learning!This 10-page PDF worksheet pack includes a variety of fun and interesting math problems related to statistics, designed to enhance your 8th-grade student's understanding of this important topic.This pack includes topics such as Constructing And Interpreting Scatter Plots, Scatter Plots: Correlation, and Line Of Best Fit. All Cazoom Math worksheets are aligned to the common core standards.Here's Wh
Subjects:
Grades:
8th
Types:
CCSS:
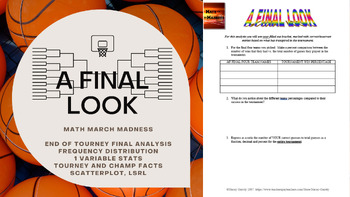
Math March Madness - A Final Look (Freq Distributions, Stats, Regression Lines)
Fill out a bracket, watch the tournament unfold and then mathematically analyze how you did! This activity is flexible enough to be used for a variety of levels. I have used all 6 pages for an AP Statistics class, and have used pages 1 through 5 for an Algebra or Algebra 2 class. You could even use it in lower levels as long as you are covering percents, and basic stats like mean, median, mode and graphing. The document is editable so you can adjust/delete to tailor to the level of statistic
Subjects:
Grades:
4th - 12th, Higher Education
Types:
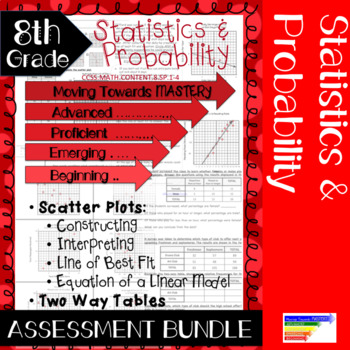
8th Grade Common Core Statistics & Probability Assessments
This bundle includes 2 assessments for each 8th grade common core statistics and probability standard. As a bonus for buying the complete set of assessments, I have included a poster/printable for each standard addressing the levels of mastery.Each assessment is created to determine the level of mastery of each standard. Levels of mastery are:→ Beginning → Emerging→ Proficient→ AdvancedThe first assessment can be used for multiple purposes:→ Pre-test→ Study Guide→ ReassessmentThe second assessme
Subjects:
Grades:
8th - 10th
Types:
CCSS:
Performance Task – Exponential Functions – Box Office Performance - Minions
Performance Task – Exponential Functions – Box Office Performance - Minions
In Box Office Performance Performance Task, students use movie data to practice constructing scatterplots, identifying best fit functions, create exponential models and solving exponential equations. As movie producers, they are analyzing movie box office data to learn how their new releases may perform.
What’s included in this Performance Task:
* Teacher Guide – Get an overview of the Performance Task, including help
Subjects:
Grades:
9th - 12th
Types:
CCSS:
Showing 1-24 of 86 results

