14 results
Common Core HSS-ID.B.6 homeschool curricula
Algebra 1 Curriculum
Get a complete High School Algebra 1 curriculum including units on solving equations and inequalities, linear functions, exponents and exponential functions, factoring polynomials, quadratics, and more! These ready-to-use Algebra 1 resources include everything you need to teach high school algebra to your on-level or lower-level/special education class. Supplements would be needed for an honors class.Each unit contains guided notes, practice worksheets for the classroom and/or homework, activiti
Grades:
8th - 11th
CCSS:
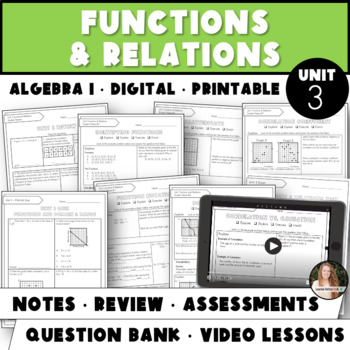
Functions, Relations and Scatterplots Unit | Algebra 1 Curriculum Unit 3 Bundle
Complete Functions, Relations, and Scatterplots unit for Algebra 1 Curriculum! Includes notes, quiz, test, video lessons, and a question bank to create your own homework, bell ringers, and customize your assessments! This curriculum is truly unlike any other on the market. Designed to make your life easier with video lessons for absent/sick students or sub days, editable reviews & assessments, and ready-made question banks so you can easily customize assessments, bellwork, and homework!!Unit
Grades:
9th
CCSS:

Progress Monitoring Quizzes Bundle--MAAP Algebra I
This is a bundle of all the progress monitoring quizzes based on the MAAP (Mississippi Academic Assessment Program) Algebra I End-of-Course Assessment.These quizzes consist of 5 or fewer multiple-choice items that mirror the practice items from the MAAP State Test Practice Booklets.Check out other products in my store!
Subjects:
Grades:
9th - 12th
CCSS:
Data and Statistics (DS) Bundle
Shape, center and spread, the normal distribution, sampling and linear regression are all explored in this introduction to statistics. These missions are aligned with Common Core Standards from the Statistics and Probability category for 8th grade and high school.
The fun stuff:
Heart rates and marathons, coins and NBA heights, this bundle gives students the chance to explore shape, center, and spread with coins, dice, heights, shoe sizes and more. They also explore linear regression and even
Subjects:
Grades:
7th - 12th
CCSS:
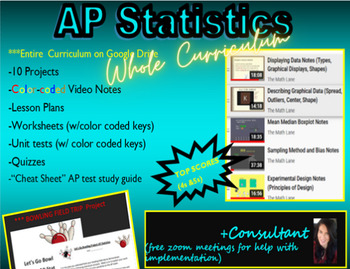
AP Statistics/Stats FULL Curriculum LINK (notes, wksts, PROJECTS) and Consultant
Get ready to supercharge your students' AP Statistics experience with this dynamic curriculum! With over 50% of students earning 4s or 5s on the AP exam, this program is proven to deliver top results. Featuring color-coded video notes, worksheets, activities, and 10 engaging projects, this curriculum is designed to keep students engaged and excited about statistics. Plus, with a Bowling Field Trip Project Opportunity included, students will have the chance to apply their knowledge in a real-worl
Subjects:
Grades:
10th - 12th
CCSS:

Other Problems--Set 2--Progress Monitoring Quiz #10--MAAP Algebra I
From these quizzes, you can identify each student’s rate of progress toward the instructional goal for the academic year. And you know immediately how well your students are performing. In this way, student progress monitoring also tells you how the student has responded to instruction, and whether or not instructional changes are needed.I mainly use these quizzes when reviewing for the end-of-course state assessment--Mississippi Academic Assessment Program (MAAP--Algebra I). When I have covered
Subjects:
Grades:
9th - 12th
CCSS:
Also included in: Progress Monitoring Quizzes Bundle--MAAP Algebra I

Other Problems--Set 1--Progress Monitoring Quiz #9--MAAP Algebra I
From these quizzes, you can identify each student’s rate of progress toward the instructional goal for the academic year. And you know immediately how well your students are performing. In this way, student progress monitoring also tells you how the student has responded to instruction, and whether or not instructional changes are needed.I mainly use these quizzes when reviewing for the end-of-course state assessment--Mississippi Academic Assessment Program (MAAP--Algebra I). When I have covered
Subjects:
Grades:
9th - 12th
CCSS:
Also included in: Progress Monitoring Quizzes Bundle--MAAP Algebra I
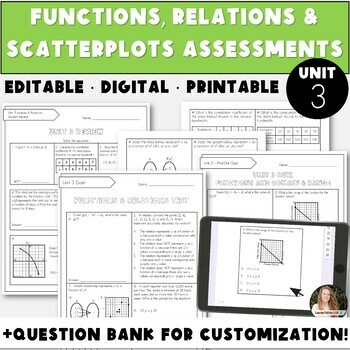
Assessments and Question Bank for Functions, Relations and Scatterplots | Unit 3
Editable Assessments for Functions, Relations and Scatterplots Unit 3 for Algebra 1 Curriculum! Includes both editable and PDF versions of the Review, Quiz & Test, plus an additional 48 problem question bank to customize your assessments! Unit 2 Review & Test Covers the Following Solving Equations & Inequalities TopicsFunction NotationFunction Notation - Real World ApplicationIdentifying FunctionsDomain and RangeDomain & Range - Real World ApplicationInterpreting Scatterplots &a
Grades:
9th
CCSS:
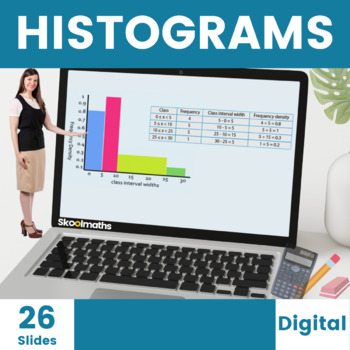
Histograms Digital Lesson for High School
Teach your High School students how to Interpret and Construct Histograms with unequal class intervals with these completely interactive digital home learning resources with engaging content and instant learner feedback. Buy this great value 26-page bundle of interactive histogram activities today to save you hours of planning and don't forget to leave an honest review if you download this worksheet for TPT credit :)Like this? You might also like...Conditional ProbabilityCalculating AveragesCond
Subjects:
Grades:
8th - 10th, Higher Education
CCSS:
Also included in: Complete Statistics and Probability Bundle | Digital and Print
Data from Home Math Project - Distance Learning About Social Distancing
***ALL PROCEEDS THAT I RECEIVE FROM THIS PROJECT WILL BE DONATED TO CHARITIES SUPPORTING STUDENTS AND FAMILIES IN NEED DURING THE COVID-19 CRISIS!***In this unprecedented time, mathematics and distance learning has the potential to provide understanding, humanity, and community as we all work to understand our experiences. In this project, students choose something about their experience while home from school to track over a period of 15 days. Students share their data in a class google sheet,
Subjects:
Grades:
6th - 12th
CCSS:
Linear Regression (DS5): HSS.ID.B.6, HSS.ID.C.7, HSS.ID.C.8...
Students will visualize the relationship between two variables, look for correlation and speculate as to causality. They will explore the trend line as a set of statistics which summarize the data and allow for estimation of additional data points. They will use the calculator to find the line of best fit and the correlation coefficient and interpret these in the context of the real world data. This mission is aligned with Common Core State Standards: HSS.ID.B.6, HSS.ID.C.7, HSS.ID.C.8, HSS.ID.C
Subjects:
Grades:
7th - 12th
CCSS:
Measured Math Flipped Class: Chapter 4 - Quadratics (Distance Learning)
Here you'll find all the materials you need to flip your Algebra II classroom.
How it works:
1) Videos of each lesson are on YouTube. Students watch the video (at home, in class, in the library, etc.) before the lesson.
2) In class, you review the material, then have them work on "homework." Worksheets - with colorcoded, work shown answer keys - are tailored to the videos and aligned to the common core. You are able to roam the class, helping students, and having them work in groups.
3) Any wo
Subjects:
Grades:
9th - 11th
CCSS:
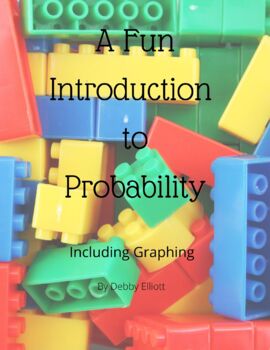
A Fun Introduction to Probability
This product contains fourteen pages that introduce probability by graphing the LEGOs and comparing the number of studs on LEGO bricks. These statistics will be figured in fractions, decimals and percentages. Graphing will be done on bar graphs and pie graphs. The worksheets are colorful and engaging for students. Students will learn to find the mean, median and mode of different numbers of studs on LEGO bricks. Students will find their own statistics and combine them with the statistics of ot
Subjects:
Grades:
4th - 9th
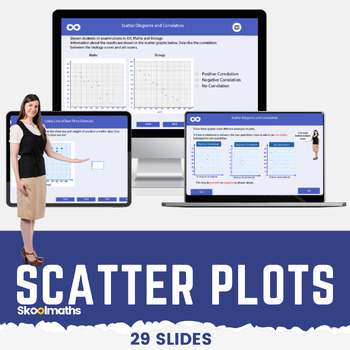
Scatter Plots | Correlation | Line of Best Fit Digital Math Lesson CCSS 8.SP.A.1
Scatter Plots | Correlation | Line of Best Fit Digital Math Lesson CCSS8.SP.A.1Want a high-engagement interactive math lesson that will teach your high school grade how to use and interpret scatter graphs; recognize correlation; draw and use lines of best fit to make predictions?In this lesson, learners will be able to:use and interpret scatter graphs of bivariate data;recognize different types of correlation;draw estimated lines of best fit; anduse lines of best fit to make predictions.The less
Subjects:
Grades:
8th - 10th
CCSS:
Also included in: Complete Statistics and Probability Bundle | Digital and Print
Showing 1-14 of 14 results

