14 results
Common Core HSS-ID.B.6 independent work packets
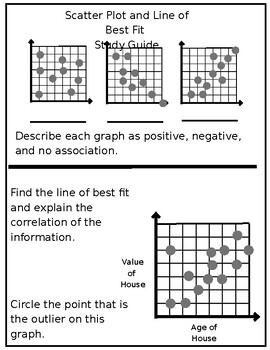
Scatter Plot Review, Study Guide, Test - Algebra - No Prep
Introducing our comprehensive Scatterplot and Line of Best Fit Study Guide, Test, and Review Activity, designed specifically for teachers and their Algebra 1 and 2 students. This educational resource is ideal for teaching the key concept of scatterplot points.The study guide offers a concise yet comprehensive overview of scatterplots, emphasizing data interpretation and the process of drawing a line of best fit. Students will receive step-by-step guidance on creating accurate scatterplots and co
Subjects:
Grades:
6th - 12th
CCSS:
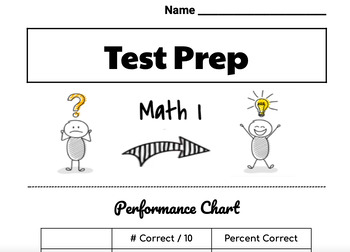
Math I End of Course Exam TEST PREP package
Math I End of Course Exam Test Prep packageIncludes 10 individual practice "lessons" that each contain 10 problems.Each practice lesson includes both a Calculator Inactive portion and a Calculator Active portion.The included Performance Chart allows for students to keep track of their progress as they strive to make improvement as they progress through the 10 lessons. I suggest providing each student a copy of the Performance Chart on colored paper to keep and record progress.The specific imple
Subjects:
Grades:
8th - 10th
CCSS:
AP Statistics - 147 Google Form Companions for ALL AP Daily Videos
Do you require your students to watch the awesome AP Daily videos that College Board provides? Me too! But I needed a way to ensure the students were actually watching this resource and taking away all the valuable information they contain. These Google Forms allowed me to confirm that students were making the most of the AP Daily videos.This download contains 147 google forms. Each form is a companion to the 147 AP daily videos located in the AP Statistics course for all units from 1-9.
Subjects:
Grades:
9th - 12th
CCSS:
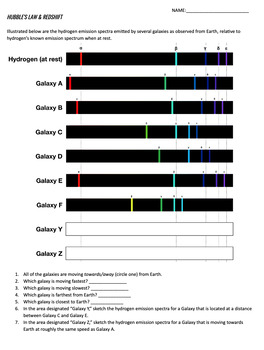
Hubble's Law & Expansion of the Universe Worksheets/Packet
This resource consists of three full-color worksheets that ask students to approach and work with Hubble's Law in three different ways.Worksheet #1 - HUBBLE'S LAW BASICS: Students use the famous "raisin bread" analogy to understand how Hubble's observations of receding galaxies led him to conclude that space itself was expanding. Students use a ruler to measure the before and after distances between "raisins" in an illustration of rising raisin bread. They find that no matter which pair of raisi
Subjects:
Grades:
8th - 12th, Higher Education
CCSS:
NGSS:
HS-ESS1-3
, HS-ESS1-2
, HS-PS4-1
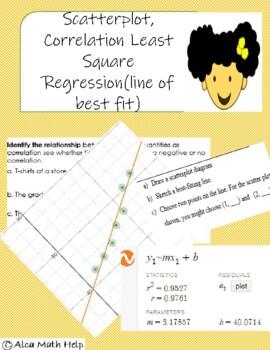
Scatterplot, Correlation and Least Square Regression (line of best fit)
At the end of this activity Students will be able to:1.Calculate the slope of a using points from the line of best fit.2.Estimate the strength and relationship between variables using a scatterplot.3.Explain correlation given the correlation coefficient4.Know facts about correlation●Answer Key included!●This activity sheet can be used as a Unit Quiz, Classwork or HomeworkIt comprises of short answer and true or false optionsPlease follow me by clicking this link
Subjects:
Grades:
11th - 12th, Higher Education, Staff
CCSS:

Scatter Plots, Income Inequality, and The Gatsby Curve
This bundle includes a student copy and Teacher Guide/answer key.In this three-part activity, students are introduced to two statistics used to describe economies: the Gini Coefficient (measuring income inequality) and Intergenerational Earnings Elasticity (IEE, measuring social mobility from generation to generation.) The activity revolves around scatter plots of Gini Coefficient vs. IEE.In part 1, focusing on placing/locating points on a scatter plot, students match verbal descriptions of fict
Subjects:
Grades:
9th - 12th
CCSS:
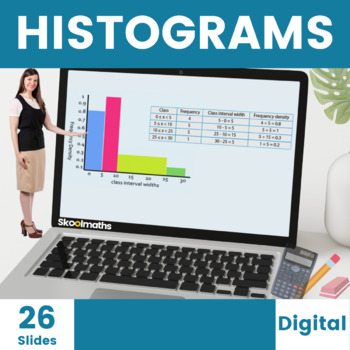
Histograms Digital Lesson for High School
Teach your High School students how to Interpret and Construct Histograms with unequal class intervals with these completely interactive digital home learning resources with engaging content and instant learner feedback. Buy this great value 26-page bundle of interactive histogram activities today to save you hours of planning and don't forget to leave an honest review if you download this worksheet for TPT credit :)Like this? You might also like...Conditional ProbabilityCalculating AveragesCond
Subjects:
Grades:
8th - 10th, Higher Education
CCSS:
Also included in: Complete Statistics and Probability Bundle | Digital and Print
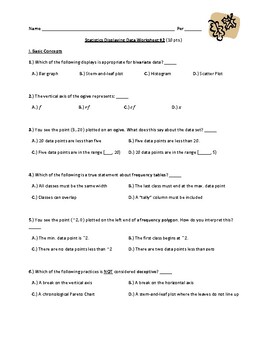
Displaying Data Worksheet #2
Review worksheet covering the following data displays: Bar graphs including Pareto charts, pie charts, dot plots, stem-and-leaf plots, frequency tables, histograms, frequency polygons, ogives, scatter plots, and time series graphs.That last page includes a review problem covering Stratification.This is the second of two review worksheets for Displaying Data. They can each be assigned individually, or together as a total review packet.
Subjects:
Grades:
11th - 12th, Higher Education
CCSS:
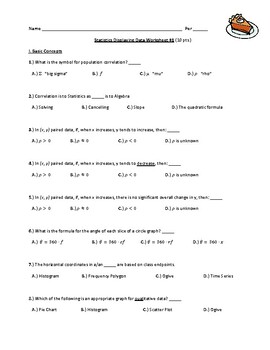
Displaying Data Worksheet #1
Review worksheet covering the following data displays: Bar graphs including Pareto charts, pie charts, dot plots, stem-and-leaf plots, frequency tables, histograms, frequency polygons, ogives, scatter plots, and time series graphs.This is the first of two review worksheets for Displaying Data. They can each be assigned individually, or together as a total review packet.
Subjects:
Grades:
11th - 12th, Higher Education
CCSS:
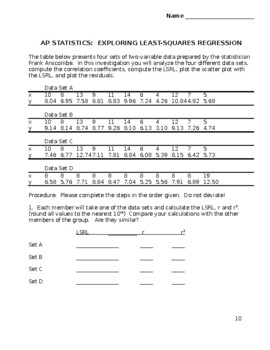
AP Statistics: Anscombe Data Activity
This activity analyzes the data set made famous by Frank Anscombe. Four data sets are provided. Students are asked to compute the regression equations, correlations, and coefficients of determination. Then the students are asked to plot the data as scatterplots as well as create residual plots. Students are asked to compare and contrast the statistics and plots. Provides valuable insight into the importance of observing the data graphically.
Subjects:
Grades:
10th - 12th
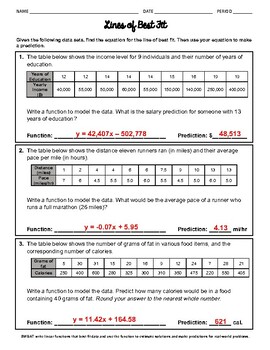
Lines of Best Fit and Making Predictions Worksheet
6 question worksheet on using technology to write the equation for a line of best fit. Then use the equation to make a prediction. #1 - 3 Given a table of values, write the function/equation and then use the function to make a prediction. #4 - 6 Given a scatterplot, write the function/equation and then use the function to make a prediction. Answer key included.VISIT US AT WWW.ALMIGHTYALGEBRA.COM FOR MORE RESOURCES AND BUNDLED DISCOUNTS!!
Subjects:
Grades:
7th - 12th
CCSS:
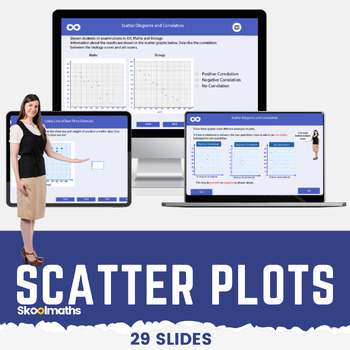
Scatter Plots | Correlation | Line of Best Fit Digital Math Lesson CCSS 8.SP.A.1
Scatter Plots | Correlation | Line of Best Fit Digital Math Lesson CCSS8.SP.A.1Want a high-engagement interactive math lesson that will teach your high school grade how to use and interpret scatter graphs; recognize correlation; draw and use lines of best fit to make predictions?In this lesson, learners will be able to:use and interpret scatter graphs of bivariate data;recognize different types of correlation;draw estimated lines of best fit; anduse lines of best fit to make predictions.The less
Subjects:
Grades:
8th - 10th
CCSS:
Also included in: Complete Statistics and Probability Bundle | Digital and Print

Scatterplot Practice, Income Inequality, Social Mobility, and The Gatsby Curve
In this three-part activity, students are introduced to two statistics used to describe economies: the Gini Coefficient (measuring income inequality) and Intergenerational Earnings Elasticity (IEE, measuring social mobility from generation to generation.) The activity revolves around scatter plots of Gini Coefficient vs. IEE.In part 1, focusing on placing/locating points on a scatter plot, students match verbal descriptions of fictional countries to points on a given scatter plot and are invited
Subjects:
Grades:
9th - 12th
CCSS:
Also included in: Scatter Plots, Income Inequality, and The Gatsby Curve
AP Statistics - AP Daily Videos: Unit 2 Google Form Companions
Do you require your students to watch the awesome AP Daily videos that College Board provides? Me too! But I needed a way to ensure the students were actually watching this resource and taking away all the valuable information they contain. These Google Forms allowed me to confirm that students were making the most of the AP Daily videos.This download contains 16 google forms. Each form is a companion to the 16 AP daily videos located in the AP Statistics Unit 2: Two Variable Data section.
Subjects:
Grades:
9th - 12th
CCSS:
Also included in: AP Statistics - 147 Google Form Companions for ALL AP Daily Videos
Showing 1-14 of 14 results

