27 results
Common Core HSS-ID.B.6 centers
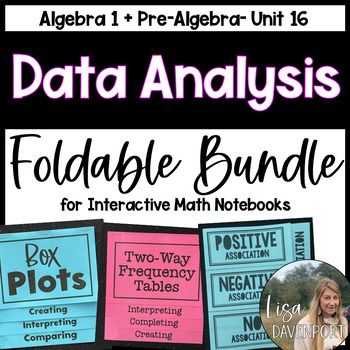
Data Analysis and Statistics Foldable Bundle
This foldable bundle includes skills associated with data and statistics taught within middle school math or algebra 1 standards:Mean, Median, Mode, RangeComparing CentersBox PlotsDot PlotsDisplaying Numerical DataAssociation within Scatter PlotsScatter PlotsWriting an Equation for a Trend LineStandard Deviation + The Empirical RuleData + Statistics in Algebra 1 Overview (Dot Plots, Histograms, Box Plots, + Two-Way Frequency TablesDetailed answer keys are included for each foldable.All of these
Grades:
7th - 10th
CCSS:
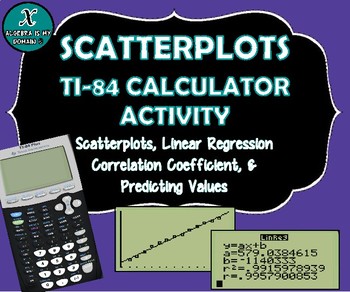
TI-84 CALCULATOR ACTIVITY - Data, Scatterplots, Regression & Line of Best Fit
This file includes four linear regression examples (all real-life data). The examples cover the following topics for the TI-84 graphing calculator:
* Creating a scatterplot
* Performing linear regression (finding the equation of the best-fit line)
* Interpreting the slope of the equation
* Calculating and interpreting the correlation coefficient
* Predicting values (using the linear regression equation)
The first example gives the step-by-step instructions to calculate all the necessary value
Subjects:
Grades:
7th - 12th, Higher Education
Types:
CCSS:
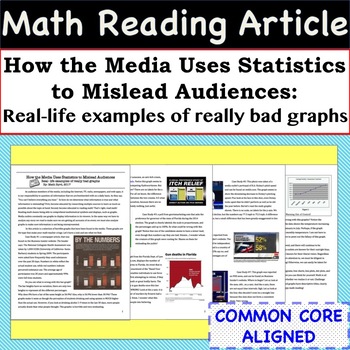
Statistics Math Article - Case Studies of Bad Graphs found in the Media
Incorporate Reading & Writing into the Math Classroom with this article and accompanying worksheet! The 4 page article is entitled - "How the Media Uses Statistics to Mislead Audiences: Real- life examples of really bad graphs". The worksheet helps students summarize the case studies and the article as a whole. This resource can be used in so many ways, some ideas are: station activity, independent reading assignment, small group activity, homework assignment, or whole class discussion.Skill
Subjects:
Grades:
8th - 11th
CCSS:
Also included in: Common Core Algebra 1 MATH READING ARTICLES - BUNDLE PRICE!
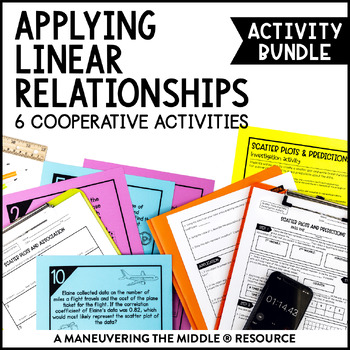
Applying Linear Relationships Activity Bundle | Parallel & Perpendicular Lines
This Applying Linear Relationships Activity Bundle includes 6 activities to support concepts of linear relationships. Students will solve problems involving direct variation, write equations of parallel and perpendicular lines, describe transformations of linear functions, calculate the correlation coefficient of linear scatter plots and write equations for lines of best fit on a scatter plot.These hands-on and engaging activities are all easy to prep! Students are able to practice and apply con
Grades:
8th - 9th
Types:
CCSS:
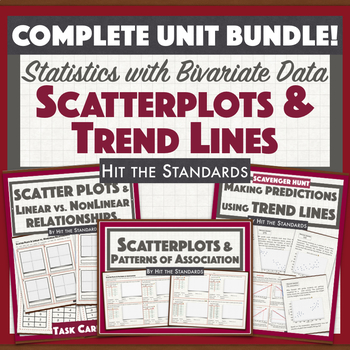
Statistics with Bivariate Data: Scatterplots & Trend Lines UNIT 6 BUNDLE 30% OFF
This unit bundles students expectations that address representing bivariates sets of data with scatterplots and representations of linear situations like constructing scatterplots and use them to describe the association of the data, constructing and using trend lines to make predictions and interpreting the slope of the line as the unit rate of the relationship, contrasting between linear proportional, linear not proportional and not linear relationships. The bundle includes worksheets, task ca
Subjects:
Grades:
6th - 9th
Types:
CCSS:
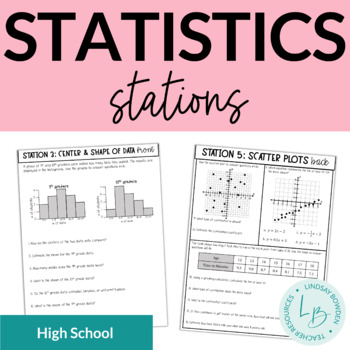
Statistics Stations
These statistics stations have 5 front and back stations that cover:histograms and dot plotstwo-way frequency tablescenter and shape of data (central tendency, peaks, symmetrical or skewed)spread of data (range, IQR, MAD)scatter plots (correlation, line of best fit, linear regression)Includes a student answer sheet and answer keys!Check out my YouTube video on stations here!You may also like:Box and Whisker Plots Notes & WorksheetsHistograms Notes & WorksheetsScatter Plots Notes and Work
Subjects:
Grades:
8th - 10th
Types:
CCSS:
Also included in: Statistics Unit Bundle
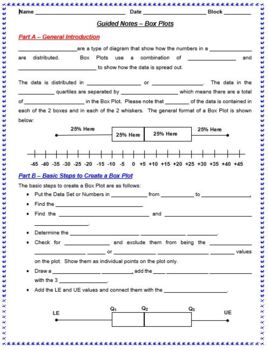
Guided Notes - Statistics Bundle (Box, Line & Scatter Plots, Histograms, Etc.)
This MS Word file is a bundle of 6 separate Guided Notes documents that review both the concept and steps involved in various statistical measures, plots and diagrams. The following Guided Notes documents are included in this bundle:Box PlotsLine PlotsHistogramsMeasures of Central TendencyScatterplots and Line of Best FitScatterplots and CorrelationThese individual Guided Notes documents have been bundled together to provide teachers with a single, complete, discounted package of 6 of the basic
Subjects:
Grades:
8th - 11th
CCSS:
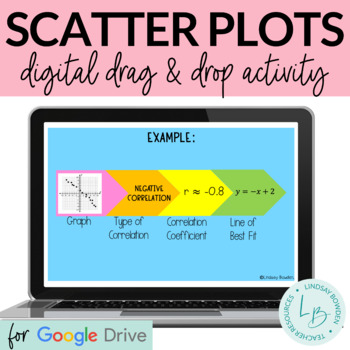
Scatter Plots Digital Drag & Drop Activity
This is the digital version of my scatter plots card sort activity created for Google Drive™. In this digital activity, students match graphs, approximate correlation coefficients (I only used +/-0.8, +/-0.5, 1, and 0), type of correlation (positive, negative, none), and line of best fit. They have to correctly match the four together. There are 12 total problems.You must have a free Google account to access the document.When you purchase, you will receive a PDF containing the link to this file.
Subjects:
Grades:
8th - 10th
Types:
CCSS:
Also included in: Distance Learning: Probability & Statistics Digital Activities Bundle
TI-84 Plus Graphing Calculator Training
Learn the features of the Texas Instruments TI-83 Plus Graphing Calculator.This resource contains 16 handouts with examples, directions, screenshots, keystrokes and extra practice (with answer keys) for 16 topics:Solving EquationsCreating GraphsScatterplotsTable FeaturesList FeaturesRegression EquationsMatrix EquationsTransforming GraphsEvaluating FunctionsResidualsGraphing Piecewise FunctionsAnalyze FunctionsOne Variable StatisticsStoring FeaturesCreating PolygonsGraphing InequalitiesUse this r
Grades:
7th - 12th, Higher Education, Adult Education
CCSS:
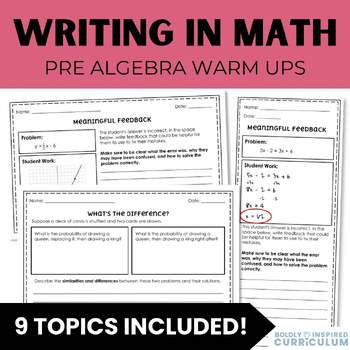
8th Grade Math Warm Ups, Exit Tickets, and Bell Ringers | Pre Algebra
This 8th grade math warm up and exit ticket bundle is the perfect no-prep, grab-and-go style activity to supplement your current Pre Algebra curriculum. These math warm ups can be used as writing prompts, exit tickets, or task cards!These math exit tickets include: Critical thinking and reflective journal prompts Error analysis and critiquing Real world math problems Compare and contrast Think, pair, share Which doesn’t belong?Topics covered in this 8th grade math warm up bundle:✅ Ratios and pro
Subjects:
Grades:
8th
Types:
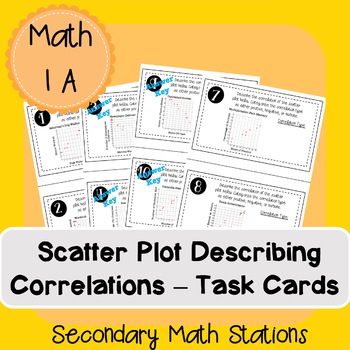
Scatter Plots -- Describing Correlations Task Cards
About this resource:This application practice has multiple uses in your classroom:Practice for an upcoming quiz or testComprehension CheckAdditional Practice during your "Activity" stationIntervention practice So much more!What topic(s) is/are covered?Scatter PlotsCorrelation types (positive, negative no/none)Describing Correlations (as x increases/decreases, y increases/decreases)Your answer key is included!How did you use this resource?I currently teach in the pull-out resource (POR) setting f
Subjects:
Grades:
6th - 10th
Types:
CCSS:
Also included in: Slope Applications Unit Activities Bundle!
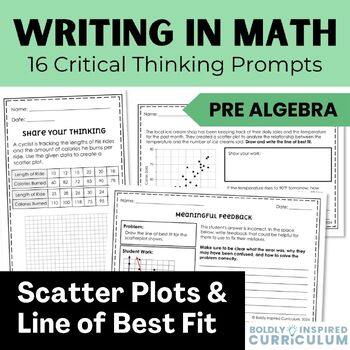
8th Grade Math Exit Tickets - Scatter Plots and Line of Best Fit Warm Ups
Get your students ready for Algebra 1 with these 8th grade math exit tickets for scatter plots and line of best fit! This is the perfect no prep, grab and go activity to supplement your current Pre Algebra or Algebra 1 curriculum. All of the writing prompts are content-aligned and can be used as warm ups, math journal prompts, or task cards.These exit tickets include: Critical thinking and reflective journal prompts Error analysis and critiquing Word problems Compare and contrast Think, pair, sh
Subjects:
Grades:
8th - 9th
Types:
CCSS:
Also included in: 8th Grade Math Warm Ups, Exit Tickets, and Bell Ringers | Pre Algebra
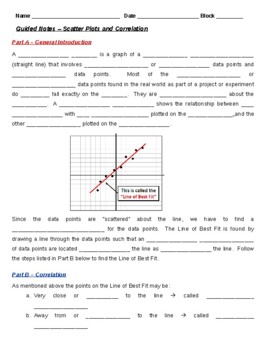
Guided Notes - Scatter Plots and Correlation (Student & Teacher Versions)
This MS Word file is a Guided Notes document that reviews both the concept and steps involved in solving and developing Scatter Plots for linear equations or functions. It also includes a review of Correlation and how to calculated it using a graphing calculator. I use these notes with my Math 1, Math 2 and Algebra 1 students immediately after I introduce this concept with my PPT presentation slidepack on the same subject. It is 3 full pages of notes for the students to complete and includes t
Subjects:
Grades:
8th - 11th
CCSS:
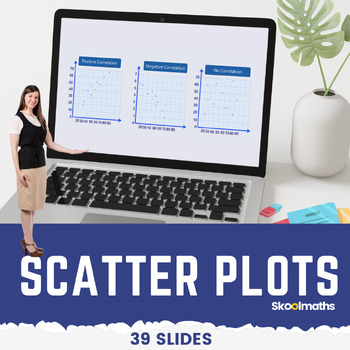
Eight Grade Scatter Plots Digital Math Lesson and Activities CCSS 8.SP.A.1
Eight Grade Scatter Plots Digital Math Lesson and ActivitiesTeach your high school grade how to use and interpret scatter graphs; recognize correlation; draw and use lines of best fit to make predictions?In this lesson, learners will be able to:use and interpret scatter graphs of bivariate data;recognize different types of correlation;draw estimated lines of best fit; anduse lines of best fit to make predictions.
Subjects:
Grades:
8th - 10th, Staff
Types:
CCSS:
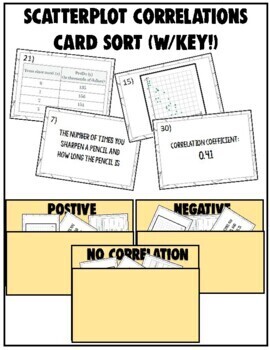
Card Sort - Scatterplot Correlation
Like this card sort? Try my Solving Linear Equations Card Sort or get in early on my NEW GROWING BUNDLE (for the price of less than TWO sorts right now!)Group Activity OR Whole Class Activity! 30 total cards:10 written scenarios 10 scatterplot graphs7 tables3 correlation coefficientsOPTIONAL SORTS - Weak/Strong Positive and Negatives Envelope included!
Subjects:
Grades:
8th - 9th
Types:
CCSS:
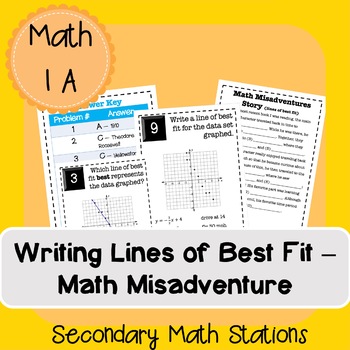
Writing Lines of Best Fit Math Misadventure (editable story)
About this resource:This application practice has multiple uses in your classroom:Practice for an upcoming quiz or testComprehension CheckAdditional Practice during your "Activity" stationIntervention practice So much more!What topic(s) is/are covered?Scatter PlotsLines of Best Fit (m/c and create your own)Your student answer space and answer key are included!How did you use this resource?I currently teach in the pull-out resource (POR) setting for an Algebra I course. This class is taught in a
Subjects:
Grades:
6th - 10th
Types:
CCSS:
Also included in: Slope Applications Unit Activities Bundle!
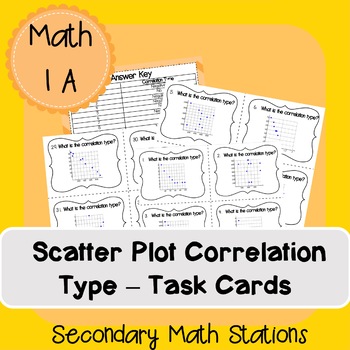
Scatter Plots -- Correlation Type Task Cards
About this resource:This application practice has multiple uses in your classroom:Practice for an upcoming quiz or testComprehension CheckAdditional Practice during your "Help with Friends" stationIntervention practice So much more!What topic(s) is/are covered?Scatter PlotsCorrelation types (positive, negative no/none)Your answer key is included!How did you use this resource?I currently teach in the pull-out resource (POR) setting for an Algebra I course. This class is taught in a block-schedule
Subjects:
Grades:
6th - 10th
Types:
CCSS:
Also included in: Slope Applications Unit Activities Bundle!

Writing Lines of Best Fit - Matching Task Cards
About this resource:This application practice has multiple uses in your classroom:Practice for an upcoming quiz or testComprehension CheckAdditional Practice during your "Help with Friends" stationIntervention practice So much more!What topic(s) is/are covered?Scatter PlotsWriting Lines of Best FitYour answer key is included!How did you use this resource?I currently teach in the pull-out resource (POR) setting for an Algebra I course. This class is taught in a block-schedule period over the dura
Subjects:
Grades:
6th - 10th
Types:
CCSS:
Also included in: Slope Applications Unit Activities Bundle!
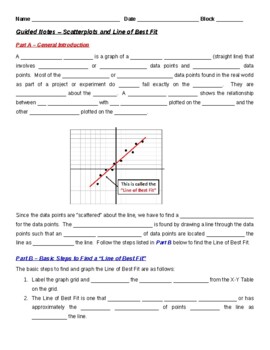
Guided Notes - Scatterplots and Line of Best Fit (Teacher & Student Versions)
This MS Word file is a Guided Notes document that reviews both the concept and steps involved in solving and developing Scatter Plots and Lines of Best Fit for linear equations or functions. I use these notes with my Math 1, Math 2 and Algebra 1 students immediately after I introduce this concept with my PPT presentation slidepack on the same subject. It is 3 full pages of notes for the students to complete and includes the detailed steps that I teach my students to use to develop and graph a
Subjects:
Grades:
8th - 10th
CCSS:

Scatter Plots and Correlation Coefficient with Desmos and/or Google Sheets
These are the slides I use to introduce correlation coefficient (informally) and using technology to generate a best fit line for data to my 9th grade Algebra 1 students.You can delete / customize / replace / or use as are the first few slides to your liking and/or district's preferred presentation style for teaching a lesson. The main item you are purchasing are slides 5-7 which show students step-by-step (with pictures) how to enter data and generate a best fit linear equation and correlation
Subjects:
Grades:
7th - 12th, Higher Education
Types:
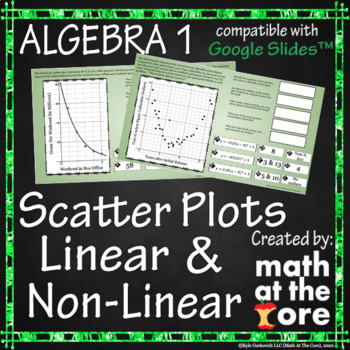
Scatter Plots - Linear & Non-Linear for Google Slides™
- Great for online and distance learning! Created to be compatible with Google Slides™!- In this digital activity, students will analyze scatter plots and determine the function of best fit. They will use the graph and the equation of that function to predict values. They should be familiar with writing the equation of linear and non-linear functions.- The activity has 33 different problems. Students will need to know how to identify which function represents the best fit for the trend given gra
Subjects:
Grades:
8th - 9th
Types:
CCSS:
Also included in: Algebra 1 Extended - Unit 9 - BUNDLE for Google Slides™
10 Free Big Brain Math Problems
This is a sample of the 100 and 180 Big Brain Math Problem I have created with a couple of my students. I write these problems on the window of my classroom everyday and get about 5-10 students a day coming to try to solve them. It's been an enjoyable experience to have students come try the problem of the day and share their solutions with me. Please consider purchasing the 100 or 180 Big Brain Math Problems. There's enough for one a day for the entire school year and range from 1-5 Star diffic
Subjects:
Grades:
9th - 12th
Types:
CCSS:
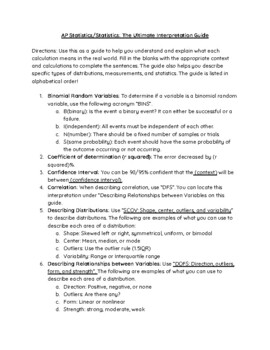
AP Statistics: Interpretations Guide: What does each statistic mean?
Hi teachers! This resource is great for your elementary, regular, or AP Statistics course. Students can use this guide all year long. We want our students to actually understand what they are calculating and connect their learning to real-world contexts! This resource will help them do just that. Some interpretations covered are mean, median, mode, and more. Here are the directions for use of the interpretations guide: Directions: Use this as a guide to help you understand and explain what each
Subjects:
Grades:
7th - 12th
CCSS:
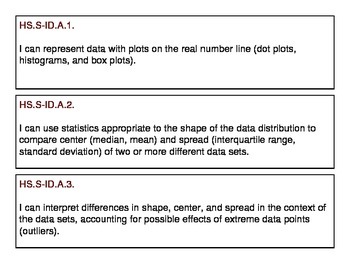
High School Probability and Statistics Concept "I Can" Statement Strips
This file contains all of the CCSS for the "Probability and Statistics" conceptual category in grades 9-12. This PDF can be printed and cut out to post for daily lessons. They will fit a pocket chart or you can add magnets to the back and display them on a magnetic whiteboard. Tabulated sections will keep your strips organized. They will fit perfectly in a file folder system or even a shoebox.
Subjects:
Grades:
7th - 12th
CCSS:
Showing 1-24 of 27 results

