17 results
Common Core HSS-ID.B.6 graphic organizers
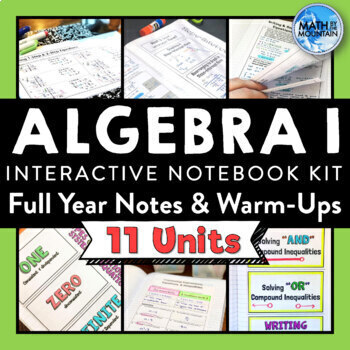
Algebra 1 Notes Interactive Notebook | Full Year Notes & Warm-Ups BUNDLE
This resource has it all with a full year of Algebra 1 notes, warm-ups, and pacing guides so you can confidently teach Algebra 1 without all of the hassle and time of making it yourself. Complete answer keys are always included. Additional bonus files are provided so you can get an easy start to using interactive notebooks, too! If you want to get all of my Algebra 1 interactive notebook kits in one place for the biggest discount, look no further, this bundle is for you! ⭐ Searching for print &a
Grades:
7th - 10th
CCSS:
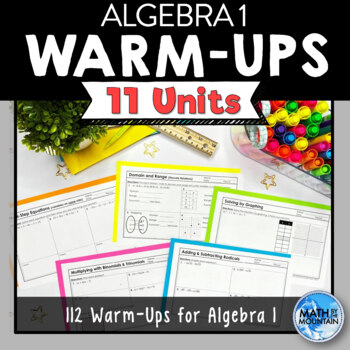
Algebra 1 Warm-Ups Full Year Bundle
Algebra 1 students need repetition to really master a concept. Recap warm-ups, also known as "bell-ringers" or "do now's," are the perfect way to start class every day and boost student achievement. Reasons to incorporate this into your classroom routine:They make it so much easier to catch and correct misconceptions that may have developed which helps to take student learning from half-baked to fully-doneThey give students another chance to ask questions about their learning from the prior dayS
Grades:
7th - 10th
CCSS:
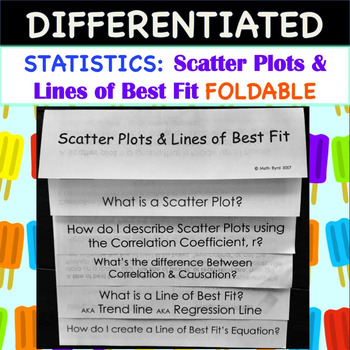
Statistics:Scatter Plots and Lines of Best Fit FOLDABLE
So Easy to Use! Simply print and fold! No need to rotate pages! Scatter Plots and Lines of Best Fit FOLDABLE also includes a PowerPoint to go along with the foldable.Foldable has 2 tiers of differentiation, perfect for the inclusive classroom! 1 set has fill-in-the-blank style notes within the foldable, while the other foldable has the notes already filled in. On both sets, students will have to work out the examples.Students will learn how to: Create Scatter PlotsDescribe Scatter Plots using Co
Subjects:
Grades:
8th - 11th
CCSS:
Also included in: Common Core Algebra 1: STATISTICS UNIT - BUNDLE PRICE!
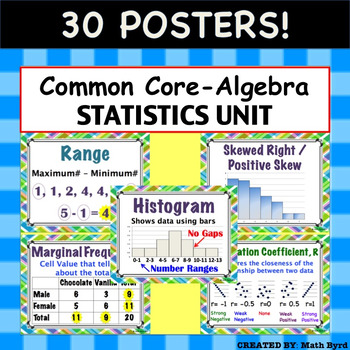
Common Core Algebra - Statistics Unit: Describing Data POSTERS
30 Posters! Each 8.5" x 11" in size. Posters are aligned with Common Core's Algebra - Statistics: Describing Data Unit. Posters Included:MeanMedianModeRangeInterquartile RangeOutlierMean Absolute DeviationMeasures of CenterMeasures of SpreadDot PlotHistogramBox PlotNormal/ Bell Shaped DistributionSkewed Right/Positive SkewSkewed Left/ Negative SkewUniform2 Way Frequency TableJoint FrequencyMarginal Frequency2 Way Relative Frequency TableConditional Relative FrequencyScatter PlotCorrelationCorrel
Subjects:
Grades:
8th - 11th
CCSS:
Also included in: Common Core Algebra 1 POSTERS - BUNDLE PRICE!
AP Statistics
This AP Statistics curriculum bundle contains the following (please take time to preview video and/or individual item previews):Guided Notes and Graphic Organizers (EDITABLE)Exhibition stations (slides) with guided notes (EDITABLE)ActivitiesProjects (EDITABLE)Exams (EDITABLE)Teacher's pacing guide and suggested order for each unit Review in AP style for preparation for the APCOMING: powerpoint with guided notes for each of 9 units NEW! UNIT 1 and UNIT 2 slides and editable notes are currently in
Subjects:
Grades:
10th - 12th
CCSS:
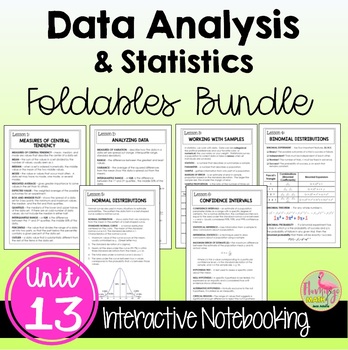
Data Analysis and Statistics FOLDABLES™ (Algebra 2 - Unit 13)
This bundle of 8-page Bound-Book-Style Foldables includes six lessons on topics in UNIT 13: Data Analysis & Statistics for your Algebra 2 Honors students. A set of finished notes and directions for creating the Foldables are also included.⭐ Bonus: A set of Google Slides for presenting the lesson and video lesson links are now included for distance learning and flipped classroom methods.☆FOLDABLESThree options of an 8-page Bound-Book Foldable® will help with differentiation.Option #1: All voc
Subjects:
Grades:
8th - 11th, Higher Education
CCSS:
Also included in: Algebra 2 Curriculum Big Bundle | Flamingo Math
About Me With Graphs
The goal of this assignment is to familiarize students with basic graphs (line, bar chart and pie chart) while explaining things about themselves. There is a blurb about the types of graphs as well as what type of information it would make sense for it to convey. What students show you about themselves is up them! A fun way to introduce graphs to students and have students introduce themselves to you.
Subjects:
Grades:
7th - 12th
CCSS:
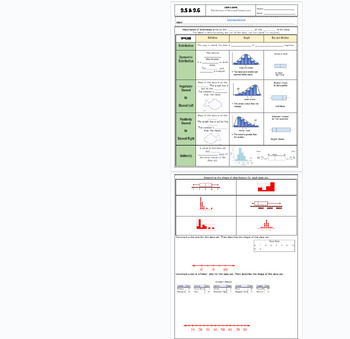
Data Distribution positive/negative skewed fillable notes UPDATED
Unit 9: Data and Stats: Updated(No 9.3/ Skip)9.5/9.6 Data Distribution (skewness)Students go over the vocabulary and complete the examples with the vocabulary scaffolded. Skewness is explained and how to identify it comparing data charts and box and whisker plots. Uses many visuals and examples to differentiate between that different graphs. Notes are scaffolded. Includes hook video hyperlinked on the "learning objective" title. Key is included and hyperlinked as a PDF in the heading highlighted
Subjects:
Grades:
6th - 12th, Higher Education, Adult Education
CCSS:
Also included in: Unit 9: Data and Statistics Fillable Notes
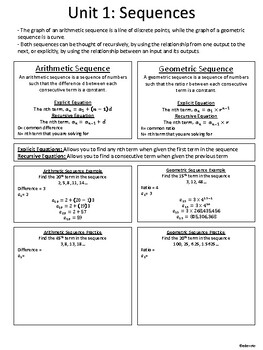
Open Up Algebra 1: EOY One Page Chapter Reviews
End of Year One Pager reviews for each chapter in Illustrative Math Algebra 1 Open Up Curriculum. Reviews include practice problems for students and act as a study guide to save for future lessons or final exams.
Subjects:
Grades:
7th - 10th
CCSS:
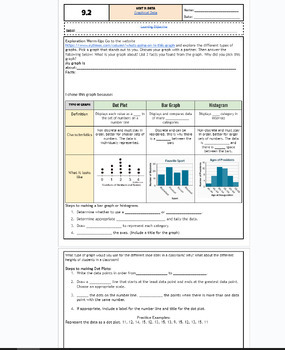
Graphical Data: Bar Charts, Dot Plots and Histograms fillable notes UPDTD
Unit 9: Data and Stats: UpdatedUpdated9.2 Graphs: bar, dot plot, histpgramStudents go over the vocabulary and define each type fo graph and what data fits for each graph. The warm up is an exploratory activity where students go on a website to search for their graph of interest and discuss the key findings. This takes around 10-15 mins and students enjoyed it! Notes are scaffolded. Includes hook video hyperlinked on the "learning objective" title. Key is included and hyperlinked as a PDF in the
Subjects:
Grades:
6th - 12th, Higher Education, Adult Education
CCSS:
Also included in: Unit 9: Data and Statistics Fillable Notes
Statistics Calculator TI-84 Plus CE Guide
This is a calculator guide for the majority of high school statistics, and the content that is not covered is t-testing. The document is in chronological order in which students should learn those topics. It is assumed that you have read through the previous pages as you read through the document. This was made specifically for the TI-84 Plus CE, as some of the screens are different than previous versions, but most of the steps stated can be followed otherwise.
Subjects:
Grades:
11th - 12th
Types:
CCSS:
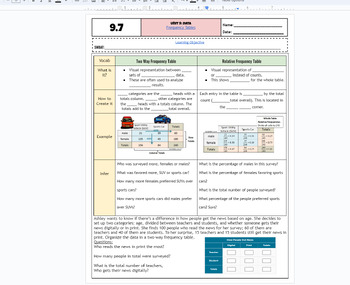
Frequency Tables & Relative Frequency Tables fillable notes UPDATED
Unit 9: Data and Stats: Updated(No 9.3/ Skip)9.7 Frequency Tables Students go over the vocabulary and complete the examples with the vocabulary scaffolded. Students examine a categorical table/frequency table and also use that information to create relative frequency tables. Different real-world examples and problems are used. Emphasized how percents and decimals are calculated. Notes are scaffolded. Includes hook video hyperlinked on the "learning objective" title. Key is included and hyperli
Subjects:
Grades:
6th - 12th, Higher Education, Adult Education
CCSS:
Also included in: Unit 9: Data and Statistics Fillable Notes
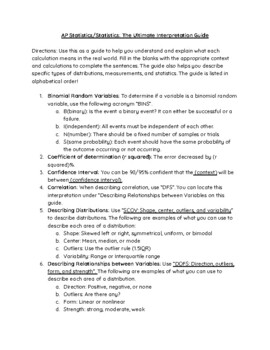
AP Statistics: Interpretations Guide: What does each statistic mean?
Hi teachers! This resource is great for your elementary, regular, or AP Statistics course. Students can use this guide all year long. We want our students to actually understand what they are calculating and connect their learning to real-world contexts! This resource will help them do just that. Some interpretations covered are mean, median, mode, and more. Here are the directions for use of the interpretations guide: Directions: Use this as a guide to help you understand and explain what each
Subjects:
Grades:
7th - 12th
CCSS:
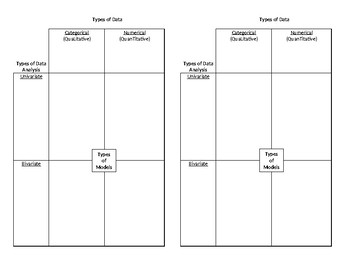
Intro to Data Analysis Graphic Organizer
I created this template for an introduction to my data analysis unit in Algebra I. We discuss and define categorical vs. numerical data, univariate vs. bivariate analysis, and the different graphs or models that apply to each. Since we use Interactive Notebooks, it is designed to be half a page.
Subjects:
Grades:
7th - 12th
CCSS:
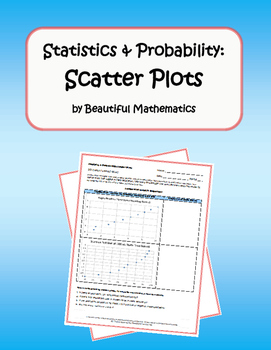
Statistics & Probability: Scatter Plots
Students will learn that straight lines are widely used to model relationships between two quantitative variables. For scatter plots that suggest a linear association, informally fit a straight line, and informally assess the model fit by judging the closeness of the data points to the line.Provide feedback and get TPT credit on future purchases:***Go to your My Purchases page. Click on the Provide Feedback button beside each purchase. You will be taken to a page where you can give a quick ratin
Subjects:
Grades:
7th - 9th
CCSS:
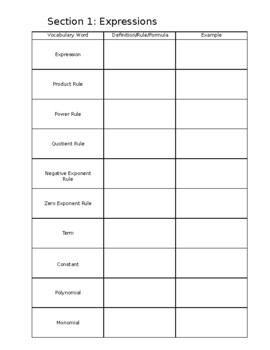
Algebra 1 EOC Vocabulary
Algebra 1 Vocabulary from each section. Completely edited. Answer key will be provided by 5/1.
Subjects:
Grades:
8th - 12th
Types:
CCSS:

Dr. Wimpey's Quick Reference for Statistics
I created this all-in-one document/foldable to help my statistics classes. It contains definitions, procedures, etc. It is useful for AP, honors, and CP levels in high school as well as college introductory statistics courses.
Subjects:
Grades:
11th - 12th, Higher Education
CCSS:
Showing 1-17 of 17 results

